Questions

[3 marks sum]

🎯

Test yourself on this topic

5 questions · timed · auto-graded

Question 13 Marks
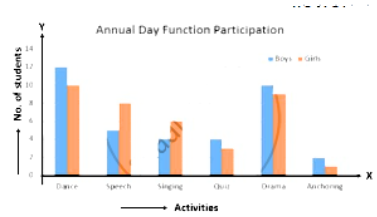
The number of students $($boys and girls$)$ of class $IX$ participating in different activities during their annual day function is given below:
Activities Dance Speech Singing Quiz Drama Anchoring
Boys $12$ $5$ $4$ $4$ $10$ $2$
Girls $10$ $8$ $6$ $3$ $9$ $1$
Draw a double bar graph for the above data.
Answer
The double bar graph is as follows:
Image
View full question & answer
Question 23 Marks
The number of students in different sections of class $IX$ of a certain school is given in the following table.
Section $IX-A$ $IX-B$ $IX-C$ $IX-D$ $IX-E$
Number of students $48$ $40$ $50$ $45$ $38$
Draw horizontal bar graph for the above data.
Answer
The horizontal bar graph is as follows:
Image
View full question & answer
Question 33 Marks
Fadil, a class IX student, scored market in different subjects$ ($each out of total $100)$ during his annual examination as given below:
Subject Maths English Science Social studies Hindi Physical education
Mark $($out of $100)$ $75$ $80$ $77$ $78$ $67$ $89$
Draw horizontal bar graph for the above data.
Answer
The horizontal bar graph is as follows:
Image
View full question & answer
Question 43 Marks
The birth rate thousand of the following states over a certain period is given below:
States Punjab Haryana U.P. Gujarat Rajasthan Jammu and Kashmir
Birth Rate $($per thousand $)$ $22.9$ $21.8$ $19.5$ $21.1$ $23.9$ $18.3$
Draw a bar graph for the above data.
Answer
The bar graph is as follows:
Image
View full question & answer
Question 53 Marks
Harmeet earns $Rs.50 000$ per month. He a budget for his salary as per the following table:
Expenses Accommodation Food Clothing Travel Miscellaneous saving
Amount $(Rs.)$ $12000$ $9000$ $2500$ $7500$ $4000$ $15000$
Draw a bar graph for the above data.
Answer
The bar graph is as follows:
Image
View full question & answer
[3 marks sum] - MATHEMATICS STD 9 Questions - Vidyadip