Questions · Page 1 of 3

4 Marks Questions

🎯

Test yourself on this topic

50 questions · timed · auto-graded

Question 14 Marks
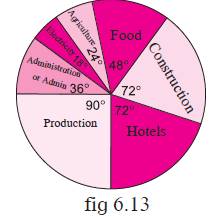
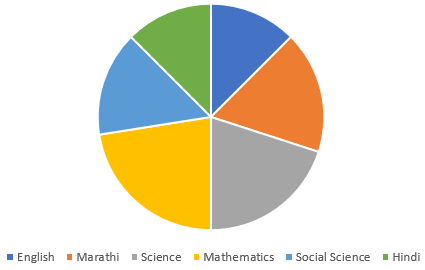
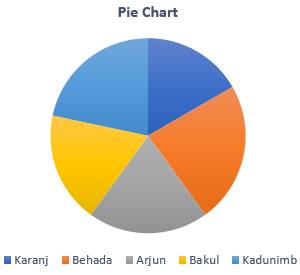
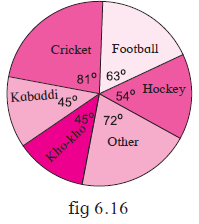
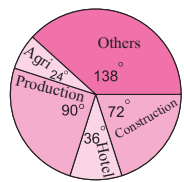
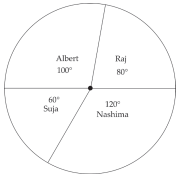
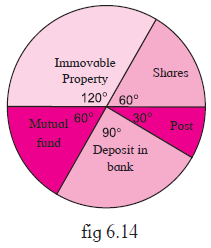
The annual investments of a family are shown in the adjacent pie diagram. Answer the following questions based on it.
(1) If the investment in shares is Rs 2000/, find the total investment.
(2) How much amount is deposited in bank?
(3) How much more money is invested in immovable property than in mutual fund?
(4) How much amount is invested in post?
Answer
COMING SOON
View full question & answer
Question 24 Marks
The pie diagram in figure 6.13 shows the proportions of different workers in a town.
Answer the following questions with its help.
(1) If the total workers is 10,000; how many of them are in the field of construction?
(2) How many workers are working in the administration?
(3) What is the percentage of workers in production?
Answer
Given: total number of workers = 10000
And central angle for number of workers in construction = 72°
And we know that,
Central angle for workers in construction
$=\frac{\text { No. of workers in construction }}{\text { Total number of workers }} \times 360^{\circ}$
No. of workers in construction $=$
$\Rightarrow \frac{\text { Central angle for workers in construction } \times \text { Total no.of workers }}{360^{\circ}}$
$\Rightarrow$ No. of workers in construction $=\frac{72^{\circ} \times 10000}{360^{\circ}}$
$\Rightarrow$ No. of workers in construction $=2000$
Thus, number of workers in the field of construction $=2000$.
(2) We know that,
Central angle for workers in admin $=\frac{\text { No. of workers in admin }}{\text { Total number of workers }} \times 360^{\circ}$
$\Rightarrow$ No. of workers in admin $=\frac{\text { Central angle for workers in admin } \times \text { Total no.of workers }}{360^{\circ}}$
$\Rightarrow$ No. of workers in admin $=\frac{36^{\circ} \times 10000}{360^{\circ}}$
$\Rightarrow$ No. of workers in admin $=1000$
Thus, number of workers working in administration = 1000
(3) First, let us find the number of workers working in production.
We know that,
Central angle for workers in production $=\frac{\text { No. of workers in production }}{\text { Total number of workers }} \times 360^{\circ}$
$\Rightarrow$ No.of workers in production $=\frac{\text { Central angle for workers in production } \times \text { Total no.of workers }}{360^{\circ}}$
$\Rightarrow$ No. of workers in production $=\frac{90^{\circ} \times 10000}{360^{\circ}}$
$\Rightarrow$ No. of workers in production $=2500$
In terms of percentage,
Percentage of workers in production $=\frac{\text { No. of workers in production }}{\text { Total no.of workers }} \times 100$
$\Rightarrow$ Percentage of workers in production $=\frac{2500}{10000} \times 100$
$\Rightarrow$ Percentage of workers in production $=25 \%$
Thus, percentage of workers in production $=25 \%$
View full question & answer
Question 34 Marks
The following table shows the percentages of demands for different fruits registered with a fruit vendor. Show the information by a pie diagram.
Answer
Let us find the measures of central angles and show them in a table.
Know that,
Measures of central angles $=\frac{\text { Percentages of demand }}{\text { Total percentages of demand }} \times 360^{\circ}$

Now we shall show the table into a pie chart.
View full question & answer
Question 44 Marks
In a tree plantation programme, the number of trees planted by students of different classes is given in the following table. Draw a pie diagram showing the information.
Answer
Let us find the measures of central angles and show them in a table.
Know that,
Measures of central angles $=\frac{\text { No. of trees }}{\text { Total number of trees }} \times 360^{\circ}$

Now we shall show the table into a pie chart.
View full question & answer
Question 54 Marks
The marks obtained by a student in different subjects are shown. Draw a pie diagram showing the information.
Answer
Let us find the measures of central angles and show them in a table.
Know that,
Measures of central angles $=\frac{\text { Marks }}{\text { Total Marks }} \times 360^{\circ}$

Now we shall show the table into a pie chart.
View full question & answer
Question 64 Marks
The following table shows the classification of percentages of marks of students and the number of students. Draw a frequency polygon from the table.
Answer
coming soon
View full question & answer
Question 84 Marks
Time alloted for the preparation of an examination by some students is shown in the table. Draw a histogram to show the information.
Answer
coming soon
View full question & answer
Question 94 Marks
In the following table, the investment made by 210 families is shown. Present it in the form of a histogram.
Answer
coming soon
View full question & answer
Question 124 Marks
The production of electric bulbs in different factories is shown in the following table. Find the median of the productions.
Answer

⇒ N = 105
$\frac{N}{2} = 52.5$
⇒ 52.5 Lies in class 50-60
⇒ Median class 50-60
L = lower limit of median class = 50
N = sum of frequencies = 105
h = class interval of median class = 10
f = frequency of median class = 20
cf = cumulative frequency of class preceding median class = 47
$\Rightarrow \text { Median }= L +\left[\frac{\frac{ N }{2}- cf }{ f }\right] \times h $
$ \Rightarrow \text { Median }=50+\left[\frac{52.5-47}{20}\right] \times 10$
⇒ Median = 52.75
⇒ In thousands = 52.75× 1000 = 52750 lamps
View full question & answer
Question 134 Marks
The following table shows the classification of number of vehicles and their speeds on Mumbai-Pune express way. Find the median of the data.
Answer
The class is discontinuous between 69-74 and 75-79
Converting the to continuous class

⇒ N = 200
$\frac{N}{2} = 100$
⇒ 100 Lies in class 74.5-79.5
⇒ Median class 74.5-79.5
L = lower limit of median class = 74.5
N = sum of frequencies = 200
h = class interval of median class = 5
f = frequency of median class = 85
cf = cumulative frequency of class preceding median class = 99
$\Rightarrow \text { Median }= L +\left[\frac{\frac{ N }{2}- cf }{ f }\right] \times h $
$ \Rightarrow \text { Median }=75+\left[\frac{100-99}{85}\right] \times 5$
⇒ Median = 74.558
View full question & answer
Question 144 Marks
On an environment day, students in a school planted 120 trees under plantation project. The information regarding the project is shown in the following table. Show it by a pie diagram.
Answer
First lets show it by a table.
Know that,
Measures of central angles $=\frac{\text { No. of scores }}{\text { Total number of scores }} \times 360^{\circ}$

Now we shall show the table into a pie chart.
View full question & answer
Question 154 Marks
The frequency distribution table shows the number of mango trees in a grove and their yield of mangoes. Find the median of data.
Answer

⇒ N = 250
$\frac{N}{2} = 125$
⇒ 125 Lies in class 100-150
⇒ Median class 100-150
L = lower limit of median class = 100
N = sum of frequencies = 250
h = class interval of median class = 50
f = frequency of median class = 30
cf = cumulative frequency of class preceding median class = 33
$\Rightarrow \text { Median }= L +\left[\frac{\frac{ N }{2}- cf }{ f }\right] \times h $
$\Rightarrow \text { Median }=100+\left[\frac{\frac{250}{2}-33}{30}\right] \times 50 $
$\Rightarrow 100+\left[\frac{125-33}{30}\right] \times 50$
⇒ Median = 253.33
View full question & answer
Question 164 Marks
Medical check up of 180 women was conducted in a health centre in a village. 50 of them were short of haemoglobin, 10 suffered from cataract and 25 had respiratory disorders. The remaining women were healthy. Show the information by a pie diagram.
Answer
First lets show it by a table.
Know that,
Measures of central angles $=\frac{\text { No. of scores }}{\text { Total number of scores }} \times 360^{\circ}$

Now we shall show the table into a pie chart.
View full question & answer
Question 174 Marks
The following table shows classification of number of workers and the number of hours they work in a software company. Find the median of the number of hours they work.
Answer

⇒ N = 1000
$\frac{N}{2} = 500$
⇒ 500 Lies in class 10-12
⇒ Median class 10-12
L = lower limit of median class = 10
N = sum of frequencies = 1000
h = class interval of median class = 2
f = frequency of median class = 500
cf = cumulative frequency of class preceding median class = 150
⇒ Median $= L + [\frac{\frac{N}{2}-cf}{f}] \times h$
⇒ Median $= 10 + [\frac{500-150}{500}] \times 2$
⇒ Median = 11.4
View full question & answer
Question 184 Marks
A survey of students was made to know which game they like. The data obtained in the survey is presented in the adjacent pie diagram. If the total number of students are 1000,
(1) How many students like cricket?
(2) How many students like football?
(3) How many students prefer other games?
Answer
Central angle for cricket = 81°
Total number of students = 1000
Then,

$\text { Central angle for cricket }=\frac{\text { Number of students who like cricket }}{\text { Total number of students }} \times 360^{\circ} $
$\Rightarrow \text { Number of students who like cricket }=\frac{\text { Central angle for cricket } \times \text { Total number of students }}{360^{\circ}} $
$\Rightarrow \text { Number of students who like cricket }=\frac{81^{\circ} \times 1000}{360^{\circ}} $
$\Rightarrow \text { Number of students who like cricket }=225 $
$\text { Thus, } 225 \text { students like cricket. } $
$\text { (2) Central angle for football }=63^{\circ} $
$\text { Total number of students }=1000 $
$\text { Then, } $
$\text { Central angle for football }=\frac{\text { Number of students who like football }}{\text { Total number of students }} \times 360^{\circ} $
$\text { Number of students who like football }= $
$ \frac{\text { Central angle for football } \times \text { Total number of students }}{360^\circ} $

$\Rightarrow \text { Number of students who like football }=\frac{63^{\circ} \times 1000}{360^{\circ}} $
$\Rightarrow \text { Number of students who like football }=175 $
$\text { Thus, } 175 \text { students like football. } $
$\text { (3) Central angle for other games }=72^{\circ} $
$\text { Total number of students }=1000 $
$\text { Then, } $
$\text { Central angle for other games } $
$=\frac{\text { Number of students who like other games }}{\text { Total number of students }} \times 360^{\circ} $
$\text { Number of students who like other games }= $
$ \frac{\text { Central angle for other games } \times \text { Total number of students }}{360^\circ} $

$\Rightarrow \text { Number of students who like other games }=\frac{72^{\circ} \times 1000}{360^{\circ}} $
$\Rightarrow \text { Number of students who like other games }=200 $
$\text { Thus, } 200 \text { students like other games. }$
View full question & answer
Question 194 Marks
The following table shows causes of noise pollution. Show it by a pie diagram.
Answer
Let us find the measures of central angles and show them in a table.
Know that,
Measures of central angles $=\frac{\text { No. of scores }}{\text { Total number of scores }} \times 360^{\circ}$

Now we shall show the table into a pie chart.
View full question & answer
Question 204 Marks
Observe the adjacent pie diagram. It shows the percentages of number of vehicles passing a signal in a town between 8 am and 10 am
(1) Find the central angle for each type of vehicle.
(2) If the number of two-wheelers is 1200, find the number of all vehicles.
Answer
coming soon
View full question & answer
Question 214 Marks
The following table shows the average rainfall in 150 towns. Show the information by a frequency polygon.
Answer
First, draw a frequency table.

Representing the information into a frequency polygon.
View full question & answer
Question 224 Marks
Draw a frequency polygon for the following grouped frequency distribution table.
Answer
First, draw a frequency table.

The representation into a frequency polygon will be as such.
View full question & answer
Question 234 Marks
The time required for students to do a science experiment and the number of students is shown in the following grouped frequency distribution table. Show the information by a histogram and also by a frequency polygon.
Answer
coming soon
View full question & answer
Question 244 Marks
In a handloom factory different workers take different periods of time to weave a saree. The number of workers and their required periods are given below. Present the information by a frequency polygon.
Answer
First, draw a frequency table.

Drawing it into a frequency polygon.
View full question & answer
Question 254 Marks
Draw a histogram for the following frequency distribution.
Answer
Let values in use of electricity be x-values and values in no. of families be y-axis.

Thus, this is the histogram.
View full question & answer
Question 264 Marks
The following table shows the daily supply of electricity to different places in a town. Show the information by a pie diagram.

PlacesFactoriesHousesRoadsShopsOfficesOthers

Supply of electricity
(Thousand units)

24147564
View full question & answer
Question 274 Marks
In a bicycle shop, number of bicycles purchased and choice of their colours was as follows. Find the measures of sectors of a circle to show the information by a pie diagram.
View full question & answer
Question 284 Marks
As deduced from a survey, the classification of skilled workers is shown in the pie diagram (fig 6.11). If the number of workers in the production sector is 4500, answer the following questions.(i) What is the total number of skilled workers in all fields?
(ii) What is the number of skilled workers in the field of constructions?
(iii) How many skilled workers are in agriculture?
(iv) Find the difference between the numbers of workers in the field of production and construction.
Image
Answer
(i) Suppose, the total number of skilled workers in all fields is $x$.
$\therefore$ the central angle for $x$ persons is $=360^{\circ}$
Central angle for number of persons in production field
$ =\frac{\text { Number of persons in production field }}{x} \times 360$
$\therefore 90  =\frac{4500}{x} \times 360$
$\therefore x  =18000 $
$\therefore$ total number of skilled workers in all the fields together $=18000$.
(ii) The angle shown for construction sector $=72^{\circ}$.
$\therefore 72=\frac{\text { Number of persons in construction }}{18000} \times 360$
$  \therefore \text { number of persons in construction field }  =\frac{72 \times 18000}{360}$
$ =3600$
(iii) The central angle for agriculture field is $24^{\circ}$.
$ \therefore 24=\frac{\text { Number of workers in agriculture }}{\text { total skilled workers }} \times 360$
$24=\frac{\text { Number of workers in agriculculture }}{18000} \times 360$
$\therefore \text { number of workers in agriculture }=\frac{24 \times 18000}{360}$
$=1200 $
(iv) The difference between angles relating fields of production and construction
$=90^{\circ}-72^{\circ}=18^{\circ} \text {. }$
$\therefore$ The difference between the central angles $=$
$ \frac{\text { Difference between numbres of workers in the fields }}{\text { Total number of skilled workers }} \times 360$
$18=\frac{\text { Difference between the numbers of workers in the fields }}{18000} \times 360 $
$\text { Difference between the numbers of workers in the two fields }  =\frac{18 \times 18000}{360}$
$ =900 $
View full question & answer
Question 294 Marks
Answer the following questions based on the frequency polygon given in the adjacent figure.
(1) Write frequency of the class 50-60.
(2) State the class whose frequency is 14.
(3) State the class whose class mark is 55.
(4) Write the class in which the frequency is maximum.
(5) Write the classes whose frequencies are zero.

Image

Answer
(1) The class marks are on the X- axis. The point whose x- coordinate is 55 (as the mid - point of the class 50-60 is 55.) y- coordinate is 10. So, the frequency of the class 50-60 is 10.
(2) The frequencies are shown on the Y-axis. The x- coordinate of the point whose y- coordinate is 14, is 25. Note the mark 14 on the Y- axis . The class mark of the class 20-30 is 25. Hence, the frequency of the class 20-30 is 14.
(3) The class mark of the class 50-60 is 55.
(4) The frequency is shown on the Y-axis. On the polygon the maximum value of the y- coordinate is 20. Its corresponding x- coordinate is 35, which is the mark of the class 30-40. Therefore, the maximum frequency is in the class 30-40.
(5) The frequencies of the classes 0-10 and 60-70 are zero.
View full question & answer
Question 304 Marks
The table below shows the net asset value (NAV) per unit of mutual funds of some companies.
Draw a histogram representing the information.
NAV (₹)8-910-1112-1310-1216-17
No. of mutual funds2040302515
View full question & answer
Question 314 Marks
The following frequency distribution table shows the classification of the number of vehicles and the volume of petrol filled in them. Find the mode of the volume.
Age (Years)1-34-67-910-1213-15
No. of vehicle3340271812
View full question & answer
Question 334 Marks
The following table shows the ages of persons who visited a museum on a certain day. Find the median age of the persons visiting the museum.
Age (Years)No. of persons
Less than 103
Less than 2010
Less than 3022
Less than 4040
Less than 5054
Less than 6071
View full question & answer
Question 364 Marks
The following table shows the frequency table of daily wages of 50 workers in a trading company. Find the mean wages of a worker, by assumed mean method.
Daily Wages (Rs)200-240240-280280-320320-360360-400
Frequency (No. of workers)51015128
View full question & answer
Question 374 Marks
The daily sale of 100 vegetable vendors is given in the following table. Find the mean of the sale by assumed mean method.
Daily sale (Rupees)1000-15001500-20002000-25002500-3000
No. of vendors15203530
View full question & answer
Question 384 Marks
The maximum temperatures in °C of 30 towns, in the last summer, is shown in the following table. Find the mean of the maximum temperatures.
Max. temp. 24-28 28-32 32-36 36-40 40-44
No. of towns 4 5 7 8 6
View full question & answer
Question 394 Marks
The percentage of marks of 50 students in a test is given in the following table. Find the mean of the percentage.
Percentage of marks0-2020-4040-6060-8080-100
No. of students3715205
View full question & answer
Question 414 Marks
The following data gives the information on the observed life time (in hour) of 225 electrical components:
Lifetime (in hours)Frequency
0 - 2010
20 - 4035
40 - 6052
60 - 8061
80 - 10038
100 - 12029
Determine the modal life time of the components.
View full question & answer
Question 424 Marks
View full question & answer
Question 444 Marks
The following pie chart gives the marks scored in an examination by a student in various subjects. If the total marks obtained by the student were 360, answer the following questions
Image
(i) Find the marks obtained in each subject.
(ii) How many more marks he got in Mathematics than in Science?
(iii) Which subject he get the least marks?
Answer
(i) Eng. - 55, S. St. - 65, Hindi - 70, Science - 80 Maths - 90
(ii) He got 10 more marks in Mathematics than Science.
(iii) He got least marks in English.
View full question & answer
Question 454 Marks
The following pie diagram represents the number of valid votes obtained by four students who contested for school captain. The total of valid votes polled was 720. Answer the following questions.
Image
(i) Who has won the election?
(ii) What is the minimum no. of votes? Who got it?
(iii) By how many votes did the winner defeat the nearest contestant?
Answer
(i) Nashima (ii) 120, Suja (iii) 40
View full question & answer
Question 464 Marks
Following is the breakup of expenditure of a family on different times of consumption.
ItemFoodClothingRentEducationFuelMedicineMiscellaneous
Expenditure in ₹160020060015010080270
Draw a pie diagram of the above data.
Answer
SELF
View full question & answer
Question 474 Marks
The following table shows the expenditure incurred by a publisher in publishing a book
ItemPaperprintingBindingadvertisingMiscellaneous
Expenditure in %35%20%10%5%30%
Draw a pie chart representing the above data.
Answer
SELF
View full question & answer
Question 484 Marks
Draw a pie diagram to represent the world population given in the following table after determining the value of a.
CountryIndiaChinaRussiaUSAOthersTotal
Percentage
poulation
1520aa25100
Answer
SELF
View full question & answer
Question 494 Marks
Draw the frequency polygon using mid-ponts for the following data on time required to do a certain job.
Time required
(in hours)
50-7070-9090-110110-130130-150150-170170-190
No. of workers28302514192
Answer
SELF
View full question & answer
Question 504 Marks
Below is given frequency distribution of marks (out of 100) obtained by students.
Marks0-1010-2020-3030-4040-5050-6060-7070-8080-9090-100
No. of students35710121512628
Draw the histogram and frequency polygon on the same graph papers.
Answer
SELF
View full question & answer
4 Marks Questions - Maths STD 10 Questions - Vidyadip