Question 15 Marks
Following table gives the distribution of students of sections A and B of a class according to the marks obtained by them.
Represent the marks of the students of both the sections on the same graph by two frequency polygons.What do you observe?
|
Section A
|
Section B
|
||||||||||||||||||||||||||
|
Marks
|
Frequency
|
Marks
|
Frequency
|
||||||||||||||||||||||||
|
|
|
|
||||||||||||||||||||||||
Answer
View full question & answer→First, we find the mid marks of the given sections A and B by using the formula,
$\text{Class mark}=\frac{\text{Lower limit+Upper limit}}{2}$
So, the new table for section A and Section B is shown below:
We can draw a frequency polygon by plotting the class marks along the horizontal axis and the frequency along the vertical axis.
Now, plotting all the points A(7, 5, 5), B(22.5, 12), C(37.5, 28), D(52.5, 30), E(67, 5, 35), F(82.5, 13) for section A.
Also, plotting all the points H(7.5, 3), I(22.5, 16), J(37.5, 25), K(52.5, 27), L(67.5, 40) and M(82.5, 10) for section B.
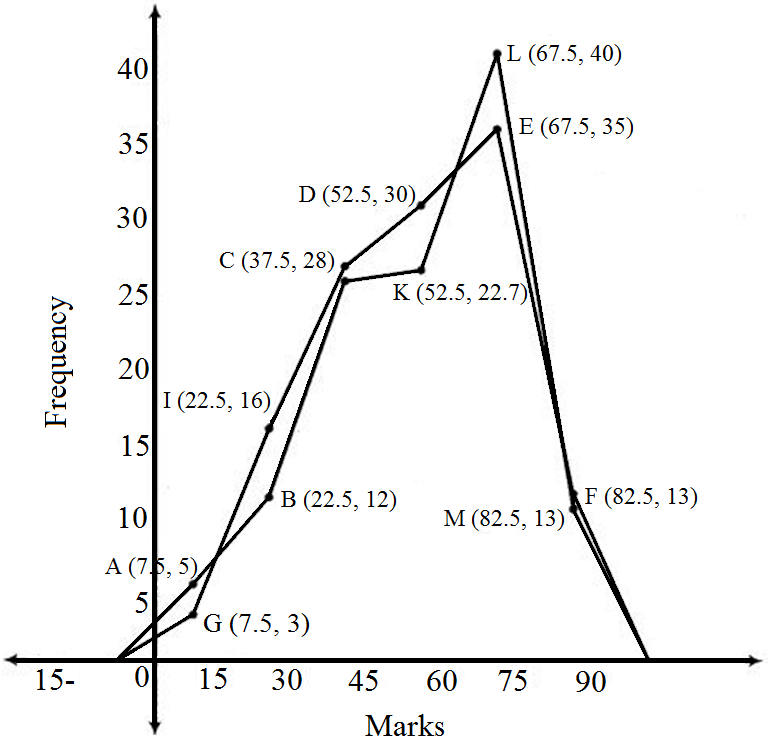
It is clear from the groph that maximum marks 67.5 score by 40 student in section B.
$\text{Class mark}=\frac{\text{Lower limit+Upper limit}}{2}$
So, the new table for section A and Section B is shown below:
|
Section A
|
Section B
|
||||||||||||||||||||||||||
|
Marks
|
Frequency
|
Marks
|
Frequency
|
||||||||||||||||||||||||
|
|
|
|
||||||||||||||||||||||||
Now, plotting all the points A(7, 5, 5), B(22.5, 12), C(37.5, 28), D(52.5, 30), E(67, 5, 35), F(82.5, 13) for section A.
Also, plotting all the points H(7.5, 3), I(22.5, 16), J(37.5, 25), K(52.5, 27), L(67.5, 40) and M(82.5, 10) for section B.
It is clear from the groph that maximum marks 67.5 score by 40 student in section B.