MCQ
A line graph is given below
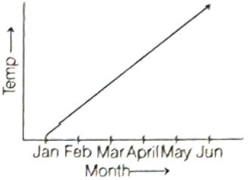
Assertion (A) In the line graph shown, the temperature increased steadily from January to May.
Reason (R) The line connecting the data points for these months is sloping upward without any significant dips.
Assertion (A) In the line graph shown, the temperature increased steadily from January to May.
Reason (R) The line connecting the data points for these months is sloping upward without any significant dips.
- ✓Both A and R are true and R is the correct explanation of A .
- BBoth A and R are true but R is not the correct explanation of A
- CA is false but R is true.
- DR is false but A is true.