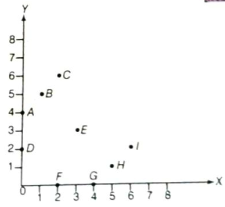
In the given figure, the position of the book on the table may be given by
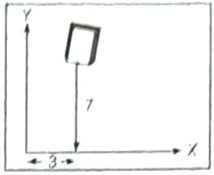
- A(7,3)
- ✓(3,7)
- C(3,3)
- D(7,7)
Answer: B.
View full solution →50 questions across 11 question groups — pick any mix to generate a MATHS paper with step-by-step answer keys.
M.C.Q. [1 Marks Each]
5 Q→02TRUE-FLASE [1 Marks Each]
5 Q→03Assertion (A) & Reason (B) MCQ
2 Q→042 Marks Questions
6 Q→053 Marks Question
9 Q→065 Marks Questions
8 Q→07Case study (4 Marks)
2 Q→08MATCH THE FOLLOWING.
1 Q→091 Marks Question
6 Q→10BLANKS [1 Marks Each]
5 Q→114 Mark Question
1 Q→One sample from each question group in this chapter. Select any group above to see the full set with answer keys.
Answer: B.
View full solution →
Answer: C.
View full solution →Answer: D.
View full solution →
Answer: C.
View full solution →
Answer: C.
View full solution →Answer: C.
View full solution →
Answer: A.
View full solution →| Size of Square (in cm ) | 2 | 3 | 15 | 5 | 4 |
| Perimeter (in cm) | 8 | 12 | 14 | 20 | 24 |
| Size of Square (in cm ) | 2 | 3 | 4 | 5 | 6 |
| Area (in cm2) | 4 | 9 | 16 | 25 | 36 |
| Years | 2003 | 2004 | 2005 | 2006 |
| Days | 8 | 10 | 5 | 12 |
| Years | 2003 | 2004 | 2005 | 2006 | 2007 |
| Number of men | 12 | 12.5 | 13 | 13.2 | 13.5 |
| Number of women | 11.3 | 11.9 | 13 | 13.6 | 12.8 |
| Number of apples | 1 | 2 | 3 | 4 | 5 |
| Cost (in ₹) | 5 | 10 | 15 | 20 | 25 |
| Time (in h) | 6 am | 7 am | 8 am | 9 am |
| Distances (in km) | 40 | 80 | 120 | 160 |
| Deposit (in ₹) | 1000 | 2000 | 3000 | 4000 | 5000 |
| Simple interest (in ₹) | 80 | 160 | 240 | 320 | 400 |
| Year | 1st | 2nd | 3rd | 4th | 5th |
| Gross Profit (in ₹) | 1700000 | 1550000 | 1140000 | 1210000 | 1490000 |
| Side (in cm) | 1 | 2 | 3 | 4 |
| Area (in cm2) | 1 | 4 | 9 | 16 |
| $x$ | 0 | 1 | 2 | 3 |
| $y$ |
| $x$ | 0 | 1 | 2 | 3 | 4 |
| $y$ |
| Age (in yr) | Boys | Girls |
| 8 | 72% | 77% |
| 9 | 75% | 81% |
| 10 | 78% | 84% |
| 11 | 81% | 88% |
| 12 | 84% | 91% |
| 13 | 88% | 95% |
| 14 | 92% | 98% |
| 15 | 95% | 99% |
| 16 | 98% | 99.5% |
| 17 | 99% | 100% |
| 18 | 100% | 100% |
Pick question groups from the list above, set marks and difficulty, and export a branded PDF with step-by-step answer keys. First 3 chapters free — no signup.