Question
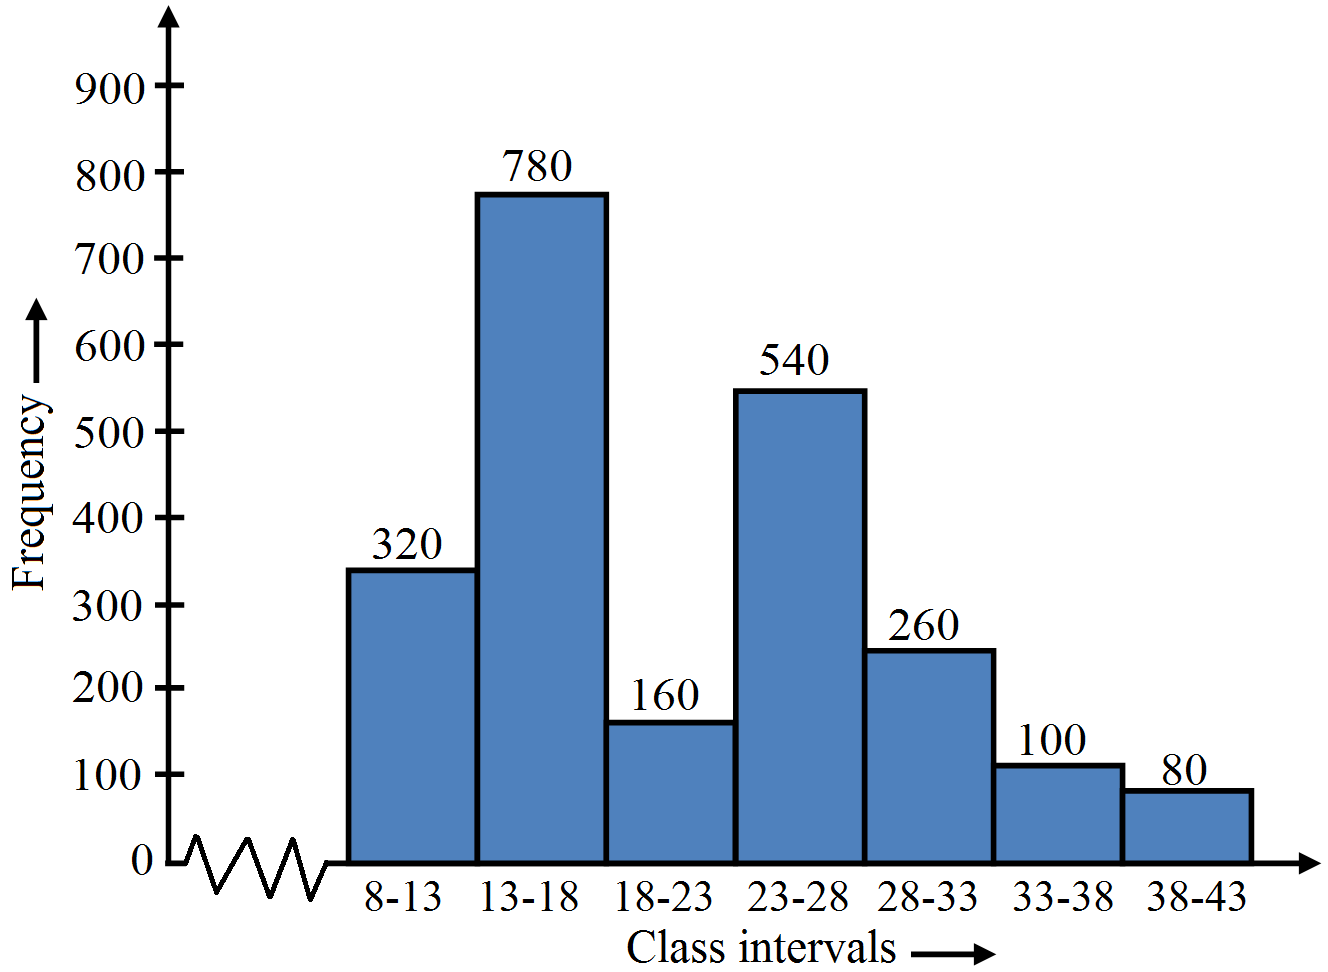
Draw a histogram for the frequency distribution of the following date:
Class interval
8-13
13-18
18-23
23-28
28-33
33-38
38-43
Frequency
320
780
160
540
260
100
80

Answer

Give frequency distribution is as below:
Class interval
8-13
13-18
18-23
23-28
28-33
33-38
38-43
Frequency
320
780
160
540
260
100
80
In the class intervals, if the upper limit of one class is the lower limit of the next class, it is know as the exclusive method of classification.
Clearly, the given frequency distribution is in the exclusive form.
We take class intervals along x-axis and frequency along y-axis.
So, we get the required histogram.
Since the scale on X-axis starts at 8, a kink (break) is indicated near the origin to show that the graph is drawn to scale beginning at 8.

Need a full question paper?

Generate a complete, print-ready paper with questions like this in minutes — across 16+ boards, with answer keys.

Start Generating Free

Similar questions

The factors of $x^3 - x^2y - xy^2{ }+ y^3$ are:
Find the missing frequencies in the following frequency distribution whose mean is $50.$
$x$ $10$ $30$ $50$ $70$ $90$ Total
$f$ $17$ $f_1$ $32$ $f_2$ $19$ $120$
In the given figure, O is the centre of the given circle and measure of arc ABC is 100°. Determine $\angle\text{ADC}$ and $\angle\text{ABC}.$
Find the perimeter and area of a qudrilateral $\text{ABCD}$ in which$ AB = 21\ cm,\angle\text{BAC}=90^\circ, AC = 20\ cm, CD = 42\ cm,$ and $AD = 34\ cm.$
The following observed values of x and y are thought to satisfy a linear equation. Write the linear equation
x 6 -6
y -2 6
Draw the graph, using the values of x, y as given in the above table. At what points the graph of the linear equation
  1. Cuts the X-axis?
  2. Cuts the Y- axis?
Draw the graphs of linear equations y = x and y = -x on the same Cartesian plane.
What do you observe?
In the given figure, O is the centre of the circle and $\angle\text{DAB}=50^\circ.$Calculate the values of x and y.
In the:
  1. AB = BC, M is the mid-point of AB and N is the mid- point of BC. Show that AM = NC.
  2. BM = BN, M is the mid-point of AB and N is the mid-point of BC. Show that AB = BC.
The follwoing table shows the average daily earnings of 40 general stores in a market, during a certain week.
Daily wages (in Rs.)
700-750
750-800
800-850
850-900
900-950
950-1000
Number of stores
6
9
2
7
11
5
Draw a histogram to represent the above data.
In the given figure, prove that
  1. CD + DA + AB > BC
  2. CD + DA + AB + BC > 2AC.
​​​​​​​