Question
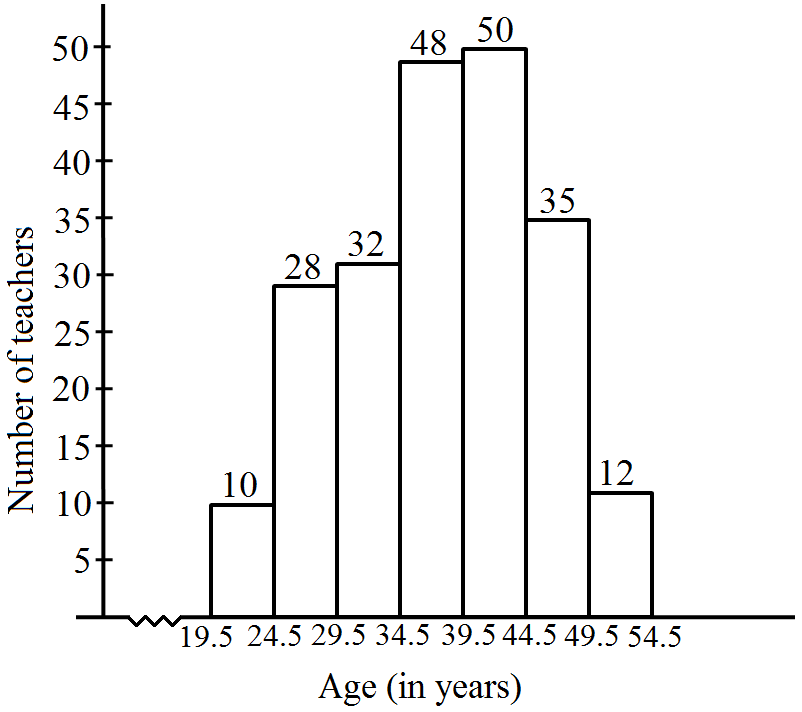
Draw a histogram to represent the following grouped frequency distribution:
| Ages (in years) | Number of teachers |
| 20-24 25-29 30-34 35-39 40-44 45-49 50-54 | 10 28 32 48 50 35 12 |