Question
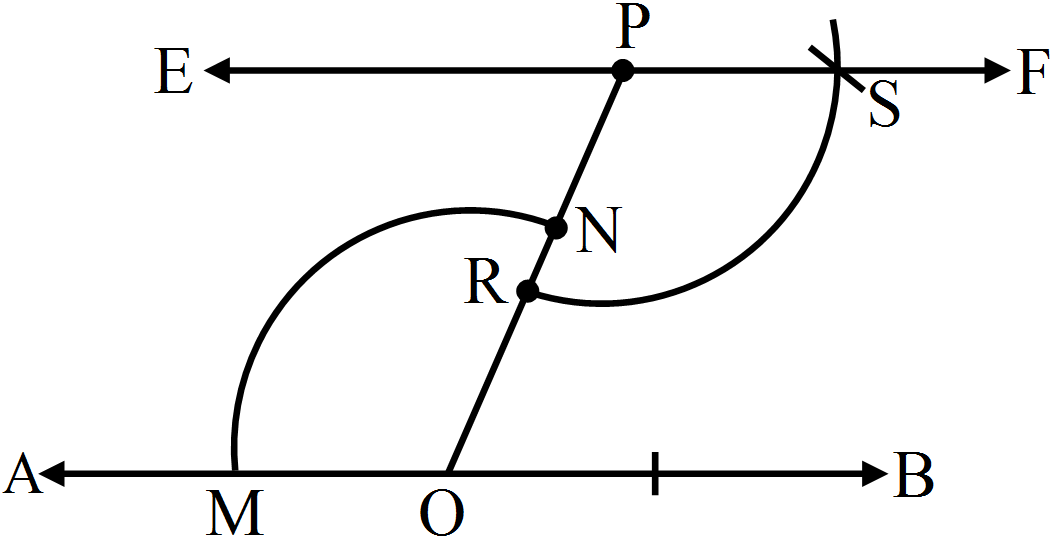
Draw a line AB. Take a point P outside it. Draw a line passing through P and parallel to AB.
Generate a complete, print-ready paper with questions like this in minutes — across 16+ boards, with answer keys.
|
S.No.
|
Numerical
|
|
i
|
2
|
|
ii
|
8
|
|
iii
|
14
|
|
iv
|
29
|
|
v
|
36
|
|
vi
|
43
|
|
vii
|
54
|
|
viii
|
61
|
|
ix
|
73
|
|
x
|
81
|
|
xi
|
91
|
|
xii
|
95
|
|
xiii
|
99
|
|
xiv
|
105
|
|
xv
|
114
|
| No. | Shapes | Rough figure | Number of lines of symmetry |
| (i) | Scalene triangle | 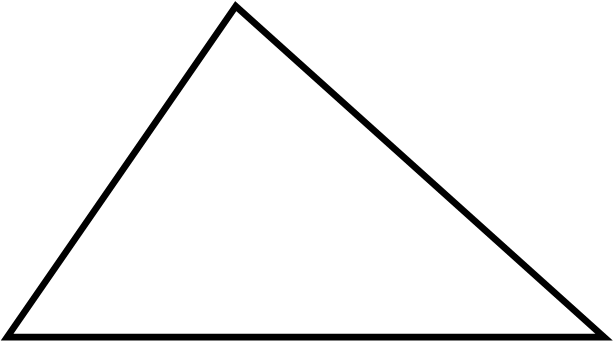 |
0 |
| (ii) | Isosceles triangle | 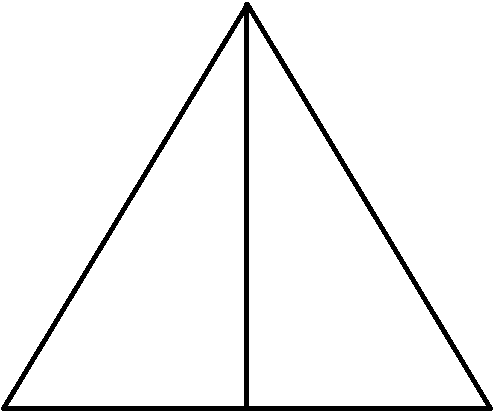 |
1 |
| (iii) | Equilateral triangle | ||
| (iv) | Rectangle | ||
| (v) | Square | ||
| (vi) | Parallelogram | ||
| (vii) | Rhombus | ||
| (viii) | Line | ||
| (ix) | Line segment | ||
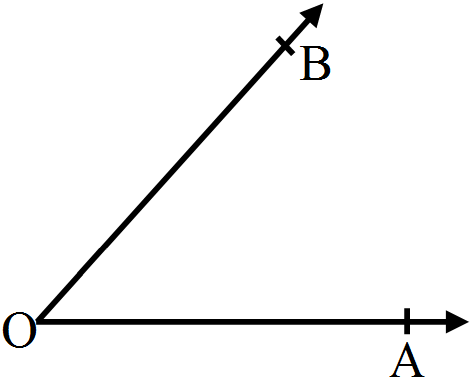
| (x) | Angle | ||
| (xi) | Isosceles trapezium | ||
| (xii) | Kite | ||
| (xiii) | Arrow head | ||
| (xiv) | Semi-circle | ||
| (xv) | Circle | ||
| (xvi) | Regular pentagon | ||
| (xvii) | Regular pentagon |
|
Years
|
1995
|
1996
|
1997
|
1998
|
1999
|
2000
|
|
Production (in thousand tonnes)
|
120
|
150
|
140
|
180
|
170
|
190
|