Question
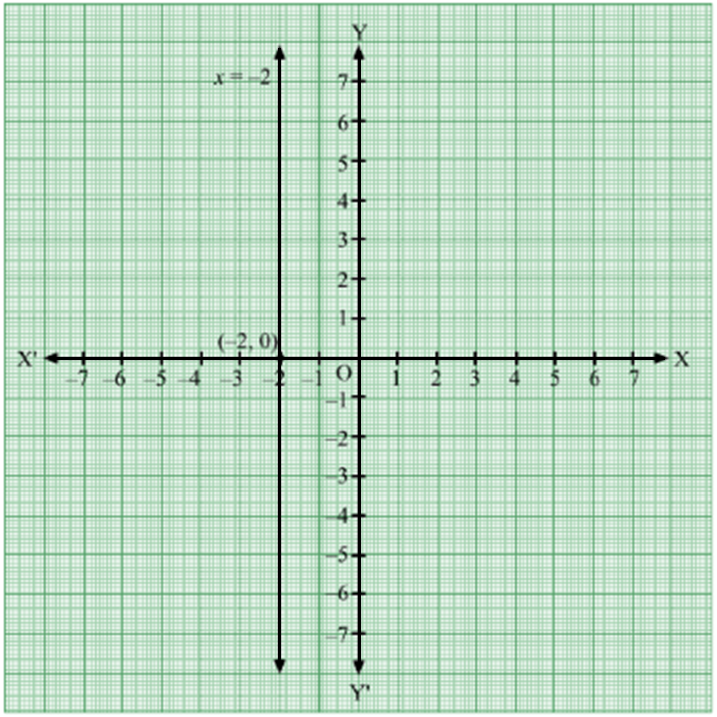
Draw the graph of the following equation.
x = -2

Answer

The equation of given line is x = -2

This equation does not contain the term of y.

So, the graph of this line parallel to y-axis passing through the point (-2, 0).

Need a full question paper?

Generate a complete, print-ready paper with questions like this in minutes — across 16+ boards, with answer keys.

Start Generating Free

Similar questions

ABCD is a parallelogram whose diagonals AC and BD intersect at O. A line through O intersects AB at P and DC at Q. Prove that $\text{ar}(\triangle\text{POA})=\text{ar}(\triangle\text{QOC}).$
In figure, OCDE is a rectangle inscribed in a quadrant of a circle of radius 10cm. If $\text{OE}=2\sqrt5\text{cm},$ find the area of the rectangle.

Write two solutions of the form x = 0, y = a and x = b, y = 0 for the following equations:
2x + 3y = 24
If the point (3, 4) lies on the graph of 3y = ax + 7, then find the value of a.
Prove that:
$\Big(\frac{64}{125}\Big)^{-\frac{2}{3}}+\frac{1}{\Big(\frac{256}{625}\Big)^{\frac{1}{4}}}+\frac{\sqrt{25}}{\sqrt[3]{64}}=\frac{65}{16}$
In the given figure, AB || CD and EF is a transversal, cutting them at G and H respectively. If $\angle\text{EGB}=35^\circ$ and $\text{QP}\perp\text{EF},$ find the measure of $\angle\text{PQH}.$

In a particular section of Class IX, 40 students were asked about the months of their birth and the following graph was prepared for the data so obtained:

Observe the bar graph given above and answer the following questions:
  1. How many students were born in the month of November?
  2. In which month were the maximum number of students born?
It being given that $\sqrt{2}=1.414,\sqrt{3}=1.732,\sqrt{5}=2.236$ and $\sqrt{10}=3.162,$ find the value of three places of decimals, of the following:
$\frac{2-\sqrt{3}}{\sqrt{3}}$
In a parallelogram ABCD, any point E is taken on the side BC. AE and DC when produced meet at a point M. Prove that $\text{ar}(\triangle\text{ADM})=\text{ar}(\text{ABMC}).$
On a certain day, the temperature in a city was recorded as under.
Time
5 a.m. 8 a.m.
11 a.m.
3 p.m.
6 p.m.
 Temperature (in °C) 
20
24
26
22
18
Illustrate the data by a bar graph.