Linear Equations In Two Variables — Maths STD 9 — Question
Gujarat BoardEnglish MediumSTD 9MathsLinear Equations In Two Variables4 Marks
Question
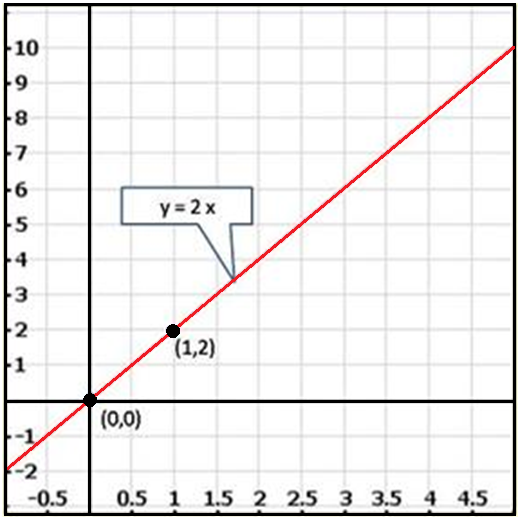
Draw the graph of the following linear equations in two variables: $y = 2x$
✓
Answer
We have, $y = 2x ...(i)$
Putting $x = 0$, we get $y = 2 \times 0 = 0$
Putting $x = 1$, we get $y = 2 \times 1 = 2$
Thus, we have the following table giving two points on the line represented by the equation $y = 2x$:
Graph of the equation $y = 2x$:
Need a full question paper?
Generate a complete, print-ready paper with questions like this in minutes — across 16+ boards, with answer keys.