Question
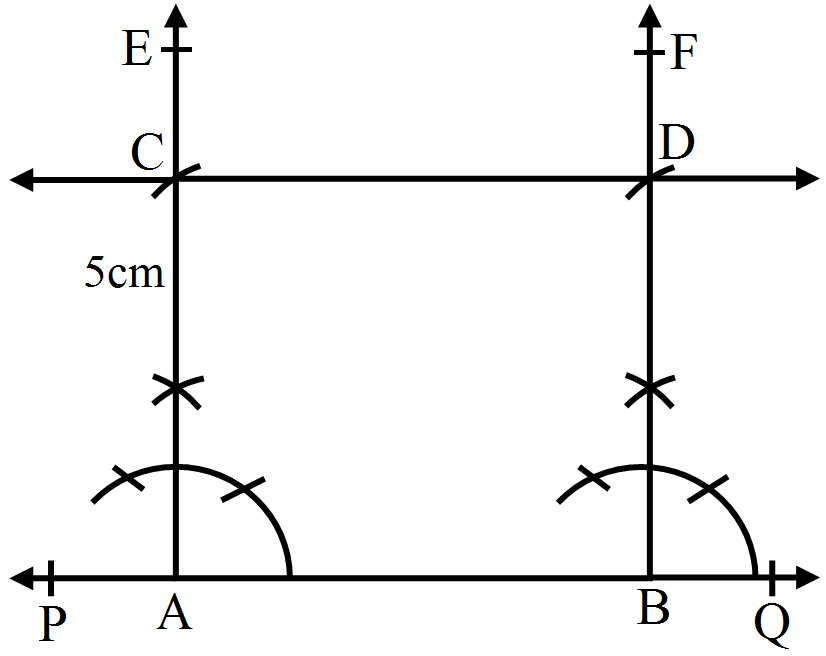
Draw two parallel lines at a distance of 5cm apart.

Answer


Steps of construction:
Step I: Draw a line PQ.
Step II: Take any two points A and B on the line.
Step III: Construct $\angle\text{PBF}=90^\circ$ and $\angle\text{QAE}=90^\circ$
Step IV: With A as centre and radius 5cm cut AE at C.
Step V: With B as centre and radius 5cm cut BF at D.
Step VI: Join CD and produce it on either side to get the required line parallel to AB and at a distance of 5cm from it.

Need a full question paper?

Generate a complete, print-ready paper with questions like this in minutes — across 16+ boards, with answer keys.

Start Generating Free

Similar questions

Find the missing value of p for the following distribution whose mean is 12.58
x:
5 8
10
12
p 20 25
f:
2
5
8
22 7 4 2
In the figures below, find the value of ‘x’.
Image
In Figure, ABC is a right triangle right angled at A. D lies on BA produced and DE perpendicular to BC intersecting AC at F. If $\angle \text{AFE}=130^\circ,$ find.
  1. $\angle \text{BDE}$
  2. $\angle \text{BCA}$
  3. $\angle \text{ABC}$
The following data shows India's total population (in millions) from 1961 to 2011.
Year
1961
1971
1981
1991
2001
2011
Population (in millions)
360
420
540
680
1020
1200
Find the missing frequency (p) for the following distribution whose mean is 7.68
x:
3
5
7
9
11 13
f:
6
8
15
p
8 4
The following data shows the average age of men in various countries in a certain year:
Country
India
Nepal
China
Pakistan
U.K
U.S.A
Average age(in years)
55
52
60
50
70
75
Represent the above information by a bar graph.
The following table shows the life expectancy (average age to which people live) in various countries in a particular year. Represent this data by a bar graph.
Country
Japan
India
Britain
Ethiopia
Cambodia
Life expectancy (in years)
76
57
70
43
36
Virat and Samrat together invested Rs 50000 and Rs 120000 to start a business. They suffered a loss of 20%. How much loss did each of them incur ?
A dice was cast 40 times and each score noted is given below. Draw up a frequency table for this data.
3, 2, 5, 6, 4, 2, 3, 1, 6, 6, 2, 3, 5, 3, 5, 3, 4, 2, 4, 5, 4, 2, 6, 3, 3, 2, 4, 3, 3, 4, 1, 4, 3, 3, 2, 2, 5, 3, 3, 4.
On a particular day in a school, the attendance in each of the classes from VI to X has been recorded as under.
Class
VI
VII
VIII
IX
X
Total no. of students
95
90
82
75
68
Number of students present on that day
92
85
78
69
62
Draw a double bar graph, choosing an appropriate scale.
Using the bar graph, answer the questions given below:
  1. Which class has the maximum number of students?
  2. Find the ratio of number of students present to the total number of students in Class VII.
  3. What per cent of Class IX students were absent?