Question
✓
Answer
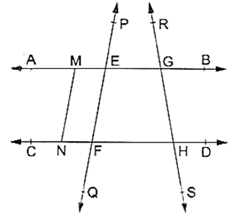
→ Six points : A,B,C,D,E,F
→ Five line segments : $\overline{ EG }, \overline{ FH }, \overline{ EF }, \overline{ GH }, \overline{ MN }$
→ Four rays : $\overrightarrow{ EP }, \overrightarrow{ GR }, \overrightarrow{ GB }, \overrightarrow{ HD }$
→ Four lines : $=\overleftrightarrow{A B}, \overleftrightarrow{C D}, \overleftrightarrow{P Q}, \overleftrightarrow{R S}$
→ Four collinear points : M,E,G,B
Need a full question paper?
Generate a complete, print-ready paper with questions like this in minutes — across 16+ boards, with answer keys.
Explore more
Similar questions
A juiceseller has a large cylindrical vessel of base radius $15\ cm$ filled up to a height of $32\ cm$ with orange juice. The juice is filled in small cylindrical glasses of radius $3\ cm$ up to a height of $8\ cm$, and sold for $₹ 15$ each. How much money does he received by selling the juice completely?
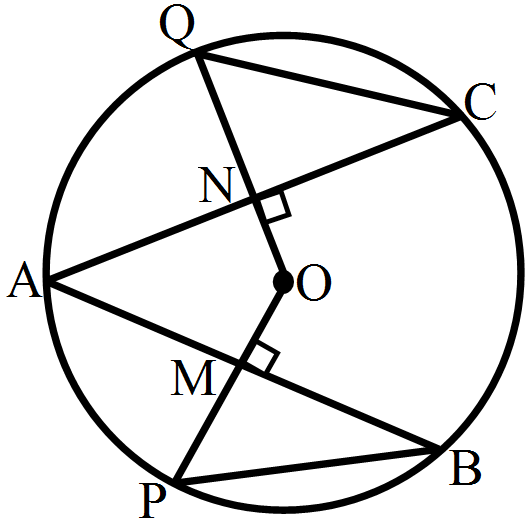
→In the adjoining figure, $O$ is the centre of a circle. If $AB$ and $AC$ are chords of the circle such that $AB = AC$, $\text{OP}\perp\text{AB}$ and $\text{OQ}\perp\text{AC},$ prove that $PB = QC$.
→The perimeter of an isoscale triangle is $32\ cm$. The ratio of the equal side to its base is $3 : 2$. Find the area of the triangle.
Hint: Ratio of sides $= 3 : 3 : 2.$
→Hint: Ratio of sides $= 3 : 3 : 2.$
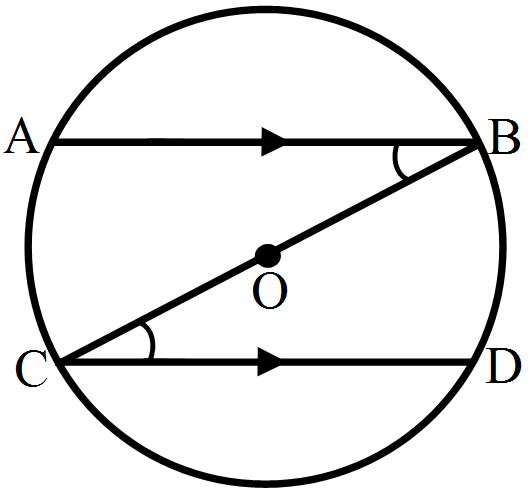
In the adjoining figure, $BC$ is a diameter of a circle with centre $O.$ If $AB$ and $CD$ are two chords such that $AB || CD,$ prove that $AB = CD.$
→If each side of a triangle is doubled, then find the ratio of area of new triangle thus formed and the given triangle.
Find the missing frequency p for the following frequency distribution whose mean is $28.25$.
→|
x
|
$15$
|
$20$
|
$25$
|
$30$
|
$35$
|
$40$
|
|
f
|
$8$
|
$7$
|
$p$
|
$14$
|
$15$
|
$6$
|
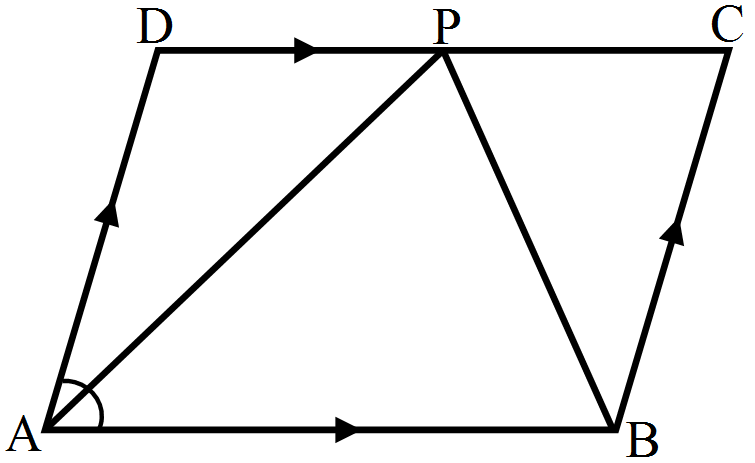
In the adjoining figure, $\text{ABCD}$ is a parallelogram in which $\angle\text{A}=60^{\circ}.$ If the bisectors of $\angle\text{A}$ and $\angle\text{B}$ meet $DC$ at $P$, prove that
$i. \angle\text{APB}=90^{\circ},$
$ii. AD = DP$ and $PB = PC = BC$,
$iii. DC = 2AD$.
→$i. \angle\text{APB}=90^{\circ},$
$ii. AD = DP$ and $PB = PC = BC$,
$iii. DC = 2AD$.
The following table gives the distribution of students of two sections according to the marks obtained by them:
Represent the marks of the students of both the sections on the same graph by frequency polygons. From the two polygons compare the performance of the two sections.
| Section A | Section B | ||
| Marks | Frequency | Marks | Frequency |
| 0-10 | 3 | 0-10 | 5 |
| 10-20 | 9 | 10-20 | 19 |
| 20-30 | 17 | 20-30 | 15 |
| 30-40 | 12 | 30-40 | 10 |
| 40-50 | 9 | 40-50 | 1 |
Following table gives the distribution of students of sections $A$ and $B$ of a class according to the marks obtained by them.
Represent the marks of the students of both the sections on the same graph by two frequency polygons.What do you observe?
→|
Section A
|
Section B
|
||||||||||||||||||||||||||
|
Marks
|
Frequency
|
Marks
|
Frequency
|
||||||||||||||||||||||||
|
|
|
|
||||||||||||||||||||||||
The ages (in years) of $360$ patients treated in a hospital on a particular day are given below:
Draw a histogram and a frequency polygon on the same graph to represent the above data.
→|
Age in years
|
$10-20$
|
$20-30$
|
$30-40$
|
$40-50$
|
$50-60$
|
$60-70$
|
|
Number of patients
|
$90$
|
$40$
|
$60$
|
$20$
|
$120$
|
$30$
|