Question
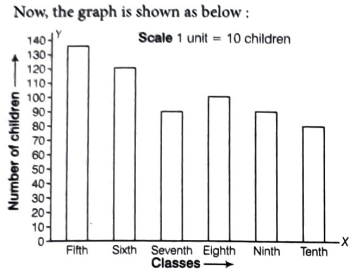
Number of children in six different classes are given below. Represent the data on a bar graph.
(i) How would you choose a scale?
(ii) Answer the following questions
(a) Which class has the maximum number of children and the minimum?
(b) Find the ratio of students of class sixth to the students of class eighth.
| Class | Fifth | Sixth | Seventh | Eighth | Ninth | Tenth |
| Number of children | 135 | 120 | 95 | 100 | 90 | 80 |
(ii) Answer the following questions
(a) Which class has the maximum number of children and the minimum?
(b) Find the ratio of students of class sixth to the students of class eighth.