Question
Solve the following linear programming problem graphically:
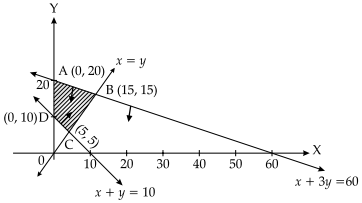
Minimize: Z = 3x + 9y
When: $x+3 y \leq 60$
$\begin{aligned} x+y & \geq 10 \\ x & \leq y \\ x & \geq 0, y \geq 0\end{aligned}$

Answer


Image
Vertices of feasible region are
A(0, 20) B(15, 15) C(5,5) D(0, 10)
Corner pointsValue of Z = 1000x + 600y
(0,20)
(15, 15)
(5,5)
(0, 10)
180
180
$60 \rightarrow$ minimum
90
$\therefore$Z = 60 is minimum at x = 5, y = 5

Need a full question paper?

Generate a complete, print-ready paper with questions like this in minutes — across 16+ boards, with answer keys.

Start Generating Free

Similar questions

Madhu exchanged her old car valued at ₹ $1,50,000$ with a new one priced at ₹$ 6,50,000$. She paid ₹ $x$ as down payment and the balance in 20 monthly equal instalments of ₹ 21,000 each. The rate of interest offered to her is $9 \%$ p.a. Find the value of $x$. [Given that: $(1.0075)^{-20}=0.86118985$]
Find: $\int \frac{(2 x-5) e^{2 x}}{(2 x-3)^3} d x$
A company has approximated the marginal cost and marginal revenue functions for one of its products by MC =$81-16 x+x^2$ and MR = $20 x-2 x^2$ respectively. Determine the profit-maximizing output and the total profit at the optimal output, assuming fixed cost as zero.
Solve the following LPP graphically:
Minimize Z = 5x + 10y
Subject to $x+2 y \leq 120$
Constraints $\begin{aligned} x+y & \geq 60 \\ x-2 y & \geq 0\end{aligned}$
and $x, y \geq 0$
Find the area of the region bounded by $y^2=9 x$ x = 2 x = 4 and the X-axis in the first quadrant.
Using properties of determinants, prove that:
$\left|\begin{array}{ccc}1 & 1+p & 1+p+q \\ 3 & 4+3 p & 2+4 p+3 q \\ 4 & 7+4 p & 2+7 p+4 q\end{array}\right|=1$
If x is real find the minimum value of $x^2-8 x+17$.
Find the intervals in which the function $f(x)=-2 x^3$$-9 x^2-12 x+1$is (i) Strictly increasing (ii) strictly decreasing.
Find the maximum value of $\left(\frac{1}{x}\right)^x$.
Given below are the consumer price index numbers (CPI) of the industrial workers.
 Year 2014 2015 2016 2017 2018 2019 2020
 Index number 145 140 150 190 200 220 230

Find the best fitted trend line by the method of least squares and tabulate the trend values.