MCQ
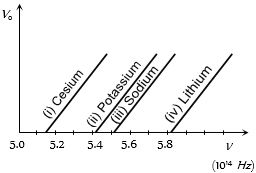
The figure shows different graphs between stopping potential $({V_0})$ and frequency $(v)$ for photosensitive surface of cesium, potassium, sodium and lithium. The plots are parallel. Correct ranking of the targets according to their work function greatest first will be
  • A
    $(i) > (ii) > (iii) > (iv)$
  • B
    $(i) > (iii) > (ii) > (iv)$
  • $(iv) > (iii) > (ii) > (i)$
  • D
    $(i) = (iii) > (ii) = (iv)$

Answer

Correct option: C.
$(iv) > (iii) > (ii) > (i)$
c
(c)The graph between $V_0$ and $v$ cut the $v$ - axis at $v_0$.
For the given graphs ${({\nu _0})_{(iv)}} > {({\nu _0})_{(iii)}} > {({\nu _0})_{(ii)}} > {({\nu _0})_{(i)}}$

$ \therefore (W_0)_{(iv)} > (W_0)_{(iii)} > (W_0)_{(ii)} > (W_0)_{(i)}$

Need a full question paper?

Generate a complete, print-ready paper with questions like this in minutes — across 16+ boards, with answer keys.

Start Generating Free