Question
The game of billiards is played with balls placed on a rectangular table. One ball is struck with the
end of a stick, called a cue. The ball bounces into other balls and relects off the sides of the table. In a real game, the ball may spin, but for mathematical purposes, it is considered that the ball travels in a straight line with the same relection and incidence angles.

Image

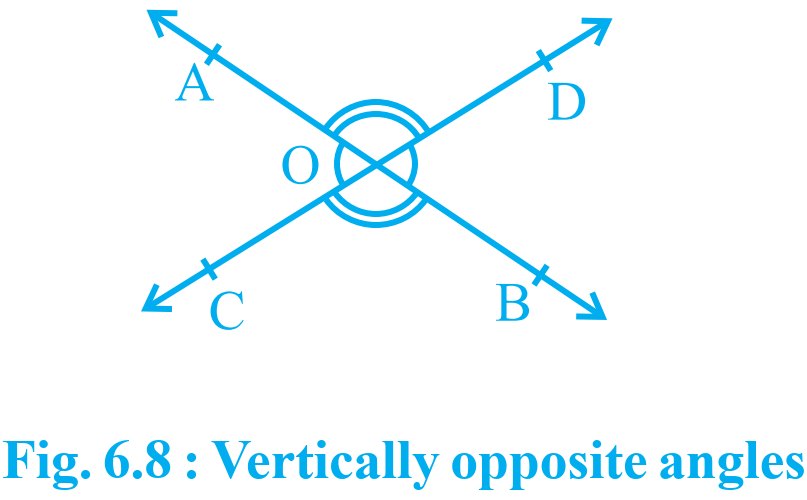
On a billiard table ABCD, the ball placed at O is struck with the cue.
1. What is the value of ∠a + ∠d?
2. Why is the line OM parallel to PN?

Answer

1. 90
   90°
2. Mathematically valid proof
● Let angles on line AMB be a, x and b and angles on line BNC be c, y and d.
x = 180 – (a + b) …..1
y = 180 – (c + d) …...2
 Adding 1 and 2,
x + y = 360 – (a + b + c + d)
  = 360 – (2a + 2c)
  = 360 – 2 × 90 = 180
Thus, lines OM and NP are parallel. 

Need a full question paper?

Generate a complete, print-ready paper with questions like this in minutes — across 16+ boards, with answer keys.

Start Generating Free

Similar questions

3. Irrational numbers can provide more precision on measuring scale.
What can be the possible arguments in favour and against this statement?
A zoo is in the shape of an isosceles trapezium.
It is divided into three zones – Zone 1, Zone 2 and Zone 3.
Animals are kept without cages in Zone 1. Zone 2 is for visitors and Zone 3 is reserved for park
authorities. 

Image
To avoid the entry of animals in zones 2 and 3, a 1.8 km long wired fencing is installed.
7. Which of the following calculations shows the area for animals?
  A. √1.35×0.65×1.15
  B. 2.15×0.35×0.65×1.15
  C. √3.15×1.35×1.65×1.15
  D. √4.30×1.35×0.65×1.15
8. “The area reserved for animals is twice the area reserved for the zoo authorities.” Do you have enough information to support this statement? Explain your answer.

The picture below shows a staircase outside a house. Each step of the staircase is congruent and there are 25 steps in the staircase from the loor to the platform and 25 steps from the platform to the roof. 

Image
7. What is the length of the staircase railing?

Read the Source/ Text given below and answer these questions:
A teacher is a person whose professional activity involves planning, organizing, and conducting group activities to develop students’ knowledge, skills, and attitudes as stipulated by educational programs. Teachers may work with students as a whole class, in small groups or one-to-one, inside or outside regular classrooms. In this indicator, teachers are compared by their average age and work experience measured in years.
For the same in 2015, the following distribution of ages (in years) of primary school teachers in a district was collected to evaluate the teacher on the above-mentioned criterion.

  1. Write the lower limit of the first-class interval:
  1. 15
  2. 20
  3. 17.5
  4. 5
  1. Determine the class limits of the fourth class interval:
  1. 25-30
  2. 30-35
  3. 40-45
  4. 45-50
  1. Find the class mark of class 45-50:
  1. 45.5
  2. 47.5
  3. 54.5
  4. 55.5
  1. Determine the class size:
  1. 4
  2. 5.5
  3. 5
  4. 6
  1. Facts or figures collected with a definite purpose are called _____.
  1. Data.
  2. Sample.
  3. Information.
  4. Statistics.
In a school camp, 40 students were divided into two groups to play a game.
The table given below shows the scores of team A and team B. 

Time(s) in minutes

Cumulative Score of Team A

Cumulative Score of Team A

0-5

14

20

5-10

35

27

10-15

30

31

15-20

35

31

20-25

44

37

25-30

52

50

7. How many score points did team A get between 10-15 minutes?
  A. 6
  B. 24
  C. 30
  D. 68
8. Which team scored more points during last 5 minutes? Justify your answer.
9. What is the mean number of score points obtained by team A in a 5-minute interval rounded to the nearest whole number?

Sodium silicate is one of the constituents in liquid soap. The graph shows the amount of sodium
silicate in liquid soap.

Image
5. How much sodium silicate (ml) is used for making 10 L of soap?
   A. 100
   B. 110
   C. 1000
   D. 10000
6. Write an equation to show the relation between quantities of sodium silicate and liquid soap. 

A forest ranger keeps track of bears in his area. He plotted their location on a graph. The origin
represents the ranger's control room’s location. To access and maintain equipment, Road x and
Road yhave been laid and paved inside the forest. They pass through the control room. 

Image
One unit on the graph paper represents 1 km. 
1. Which bear is nearest to a paved road?
  A. Bear 389 
  B. Bear 415
  C. Bear 425
  D. Bear 467
2. Bear 467 has been injured. The forest rescue team starts from the control room and decides to use the paved road as much as possible. Which road should they take?
3. How far is Bear 425 from Road x?
4. A tiger is at (11, 4). How far from it is the nearest bear?
  A. 2 km
  B. 4 km 
  C. 5 km
  D. 7 km
5. In the forest, rain shelters are at an interval of 2 km along paved roads. A forest ranger is travelling on Road x. He crosses a rain shelter located at (3, 0).
What is likely to be the location of the next shelter?
6. The control room receives a message about trespassers located at (–9, –8). The trespassers were seen moving towards Road x on foot. The ranger immediately dispatches a team of guards in a jeep towards them. The guards encounter the trespassers before crossing Road x.
Which of the following is most likely to be the location of the encounter?
   A. (–9, –14)
   B. (–9, –5)
   C. (–9, 4)
   D. (9, 5)
7. Ravi planted a red maple tree sapling. The height of the sapling is 0.25 m. The average growth rate of the height of a red maple tree is 0.27 m per year.
The average life of a red maple tree is 80–100 years. Ravi estimated that his tree will grow up to 27 m.
What is the likely reason behind his estimation?
8. Which of the following equations represents the height (h) of the red maple tree after ‘t’ years of planting?
   A. h=0.25+0.27
   B. h=0.25t+0.27
   C. h=0.25+0.27t
   D. h=0.25+0.27t
9. Which of the following is true for the line with equation: 1.x+0.y-4=0?
   A. The distance of the line from the x-axis is 1.
   B. The distance of the line from the Y-axis is 4.
   C. The distance of the line from the Y-axis is –1.
   D. The distance of the line from the x-axis changes from 1 to –4.
10. The equation of a line is ax+by+c=0.
What conditions ensure that the distance of the line from an axis is constant?
   A. c = 0 and a, b ≠ 0
   B. c < 0 and a, b ≠ 0
   C. c, b ≠ 0 and a =1
   D. c, b ≠ 0 and a = 0

Read the Source/ Text given below and answer these questions:
The following data given the weight (in grams) of 30 oranges picked from a basket:
106, 107, 76, 109, 187, 95, 125, 92, 70, 139, 128, 100, 88, 84, 99, 113, 204, 141, 136, 123, 90, 115, 110, 97, 90, 107, 75, 80, Frequency distribution table:
Class Interval
Tally marks
Frequency
60 - 80
|||
3
80 - 100
|||| ||||
10
100 - 120
|||| ||||
9
120 - 140
||||
5
140 - 160
|
1
160 - 180
-
0
180 - 200
|
1
200 - 220
|
1
Total
30
30

  1. Class Size of given class data:
  1. 20
  2. 10
  3. 30
  4. 15
  1. Classmark of forth class:
  1. 70
  2. 130
  3. 20
  4. 15
  1. The number of oranges, whose weight is more than 180g:
  1. 1
  2. 3
  3. 2
  4. 4
  1. The number of oranges, whose weight is less than 100g:
  1. 10
  2. 3
  3. 5
  4. 13
  1. The range of data is:
  1. 70
  2. 204
  3. 134
  4. 274