The time period of a particle executing $S.H.M.$ is $8 \,s$. At $t=0$ it is at the mean position. The ratio of distance covered by the particle in $1^{\text {st }}$ second to the $2^{\text {nd }}$ second is .............. $s$
Medium
Download our app for free and get started
(c)
$T=8 \,s$
$ \omega=\frac{2 \pi}{8}=\frac{\pi}{4}$
$x_1=A \sin \frac{\pi}{4}=\frac{A}{\sqrt{2}}$
$x_2=A \sin \frac{\pi}{4} \times 2-A \sin \frac{\pi}{4}=A-\frac{A}{\sqrt{2}}=\frac{A}{\sqrt{2}}(\sqrt{2}-1)$
$\frac{x_1}{x_2}=\frac{1}{\sqrt{2}-1} \times \frac{\sqrt{2}+1}{\sqrt{2}+1}=\sqrt{2}+1$

Download our appand get started for free
Experience the future of education. Simply download our apps or reach out to us for more information. Let's shape the future of learning together!No signup needed.*
Similar Questions
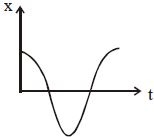
- 1Dispacement time graph of a particle executing $SHM$ is as shown in the figure. Corresponding graph between $PE$ and time isView Solution
- 2A particle executes simple harmonic motion. Its amplitude is $8 \,cm$ and time period is $6 \,s$. The time it will take to travel from its position of maximum displacement to the point corresponding to half of its amplitude, is ............. $s$View Solution
- 3View SolutionA hollow sphere is filled with water through a small hole in it. It is then hung by a long thread and made to oscillate. As the water slowly flows out of the hole at the bottom, the period of oscillation will
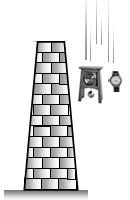
- 4A man having a wrist watch and a pendulum clock rises on a $TV$ tower. The wrist watch and pendulum clock per chance fall from the top of the tower. ThenView Solution
- 5The equation of a simple harmonic motion is $X = 0.34\cos (3000t + 0.74)$ where $X$ and $t$ are in $mm$ and $sec$. The frequency of motion isView Solution
- 6A particle is performing $S.H.M.$ with energy of vibration $90 \,J$ and amplitude $6 \,cm$. When the particle reaches at distance $4 \,cm$ from mean position, it is stopped for a moment and then released. The new energy of vibration will be ........... $J$View Solution
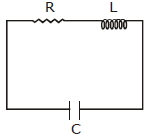
- 7An $LCR$ circuit is equivalent to a damped pendulum. In an $LCR$ circuit the capacitor is charged to $Q_0$ and then connected to the $L$ and $R$ as shown below.View Solution
If a student plots graphs of the square of maximum charge $( Q_{Max} ^2 )$ on the capacitor with time$(t)$ for two different values $L_1$ and $L_2 (L_1 > L_2)$ of $L$ then which of the following represents this graph correctly? (plots are schematic and not drawn to scale)
- 8View SolutionTo make the frequency double of a spring oscillator, we have to
- 9A simple pendulum of mass $m$ executes $S.H.M.$ with total energy $E$. If at an instant it is at one of extreme positions, then its linear momentum after a phase shift of $\frac{\pi}{3} \,rad$ will beView Solution
- 10The force constants of two springs are ${K_1}$ and ${K_2}$. Both are stretched till their elastic energies are equal. If the stretching forces are ${F_1}$ and ${F_2}$, then ${F_1}:{F_2}$ isView Solution