MCQ
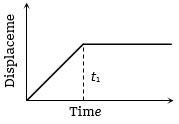
The $x - t$ graph shown in figure represents
- AConstant velocity
- BVelocity of the body is continuously changing
- CInstantaneous velocity
- ✓The body travels with constant speed upto time ${t_1}$ and then stops
Generate a complete, print-ready paper with questions like this in minutes — across 16+ boards, with answer keys.