Two pendulums have time periods $T$ and $\frac{{5T}}{4}.$They start $S.H.M.$ at the same time from the mean position. What will be the phase difference between them after the bigger pendulum has complete one oscillation ..... $^o$
Easy
Download our app for free and get started
(b) $\frac{{5T}}{4} = T + \frac{T}{4}$
By the time, the bigger pendulum makes one full oscillation, the smaller pendulum will make $\left( {1 + \frac{1}{4}} \right)$ oscillation. The bigger pendulum will be in the mean position and the smaller one will be in the positive extreme position. Thus, phase difference $= 90°$

Download our appand get started for free
Experience the future of education. Simply download our apps or reach out to us for more information. Let's shape the future of learning together!No signup needed.*
Similar Questions
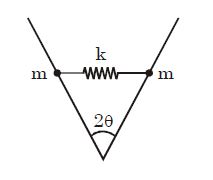
- 1Two particles of mass $m$ are constrained to move along two horizontal frictionless rails that make an angle $2\theta $ with respect to each other. They are connected by a spring with spring constant $k$ . The angular frequency of small oscillations for the motion where the two masses always stay parallel to each other (that is the distance between the meeting point of the rails and each particle is equal) isView Solution
- 2The length of simple pendulum is increased by $44\%$. The percentage increase in its time period will be ..... $\%$View Solution
- 3The oscillation of a body on a smooth horizontal surface is represented by the equation $x= Acos$$\omega t$View Solution
where $x=$ displacement at time $t$
$\omega =$ frequency of oscillation
Which one of the following graphs shows correctly the variation $a$ with $t$ ?
Here $a=$ acceleration at time $t$
$T=$ time period
- 4Two simple harmonic motions of angular frequency $100$ and $1000\,\,rad\,s^{-1}$ have the same displacement amplitude. The ratio of their maximum acceleration isView Solution
- 5View SolutionTwo particles are oscillating along two close parallel straight lines side by side, with the same frequency and amplitudes. They pass each other, moving in opposite directions when their displacement is half of the amplitude. The mean positions of the two particles lie on a straight line perpendicular to the paths of the two particles. The phase difference is
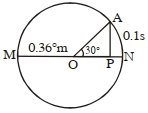
- 6The point $A$ moves with a uniform speed along the circumference of a circle of radius $0.36\, m$ and covers $30^{\circ}$ in $0.1\, s$. The perpendicular projection $'P'$ from $'A'$ on the diameter $MN$ represents the simple harmonic motion of $'P'.$ The restoration force per unit mass when $P$ touches $M$ will be ...... $N$View Solution
- 7If the length of a pendulum is made $9$ times and mass of the bob is made $4$ times then the value of time period becomesView Solution
- 8Two particles oscillating in $SHM$ along two very close parallel path such that they have same mean position. The equation of $SHM$ of two particles are $x_1 = A\, sin\,\omega t$ and $x_2 = A\,sin(\omega t + \phi )$ respectively. If maximum distance between them is $\frac{6A}{5}$ then $\phi $ equal to ..... $^o$View Solution
- 9View SolutionIdentify the function which represents a nonperiodic motion.
- 10In an elevator, a spring clock of time period $T_S$ (mass attached to a spring) and a pendulum clock of time period $T_P$ are kept. If the elevator accelerates upwardsView Solution