Question
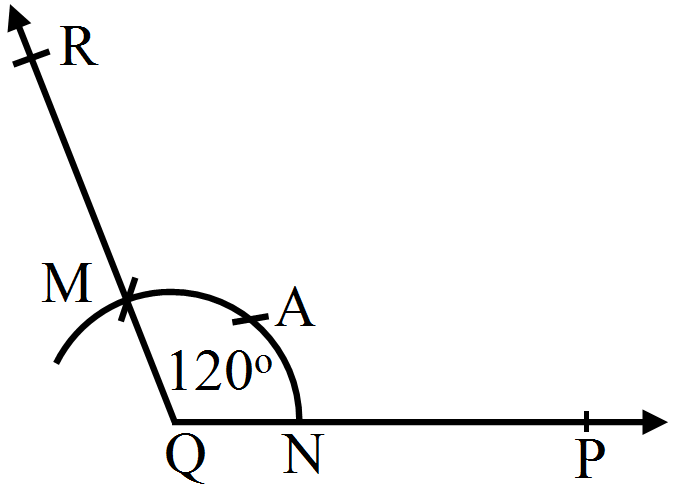
Using a pair of compasses construct the following angles:
120°

Answer


Steps for construction:
  1. Draw a ray QP.
  2. With Q as the centre and any convenient radius, draw an arc cutting QP at N.
  3. With N as the centre and the same radius, cut the arc at A. Again, with A as the centre and the same radius, cut the arc at M.
  4. Draw QM and produce it to R.
$\angle\text{PQR}$ is the required angle of 120°.

Need a full question paper?

Generate a complete, print-ready paper with questions like this in minutes — across 16+ boards, with answer keys.

Start Generating Free

Similar questions

i. $3 \frac{1}{3}-1 \frac{1}{4}$
ii. $5 \frac{1}{2}-3 \frac{1}{3}$
iii. $7 \frac{1}{8}-6 \frac{1}{10}$
iv. $7 \frac{1}{2}-3 \frac{1}{5}$
Carry out the following Divisions:
i. $\frac{2}{3} \div \frac{1}{4}$
ii. $\frac{5}{9} \div \frac{3}{2}$
iii. $\frac{3}{7} \div \frac{5}{11}$
iv. $\frac{11}{12} \div \frac{4}{7}$
If we want to show the fractions $\frac{3}{10}, \frac{9}{20}, \frac{19}{40}$ on the number line, how big should the unit be?
Find the HCF of the numbers in the following using the division method:391, 425, 527
The number of customers who came to a juice centre during one week is given in the table below. Make two different bar graphs to show this data.
(On Y-axis, 1 cm = 10 customers, 1 cm = 5 customers)
Type of juiceOrangePineappleAppleMangoPomegranate
Number of customers5030256510
Ramanujan’s Magic square.

Image

  • Add the four numbers in the rows, the columns and along the diagonals of this square.
  • What is the sum?
  • Is it the same every time?
  • What is the peculiarity?
  • Look at the numbers in the first row, 22 – 12 – 1887. Find out why this date is special.

Obtain and read a biography of the great Indian mathematician Srinivasa Ramanujan.

Find the total cost of levelling the shaded path of uniform width 2 metres, laid in the rectangular field shown below, if the rate per $m ^2$ is Rs. 100.

Write the number of faces, edges and vertices of each shape in the table.

Image

Draw the perpendicular bisector of a given line segment AB of length 6cm.
This bar graph shows the maximum temperatures in degrees Celsius in different cities on a certain day in February. Observe the graph and answer the questions:

Image

  1. What data is shown on the vertical and the horizontal lines?
  2. Which city had the highest temperature?
  3. Which cities had equal maximum temperatures?
  4. Which cities had a maximum temperature of 30 °C?
  5. What is the difference between the maximum temperatures of Panchgani and Chandrapur?