CBSE BoardEnglish MediumSTD 10ScienceElectricity2 Marks
Question
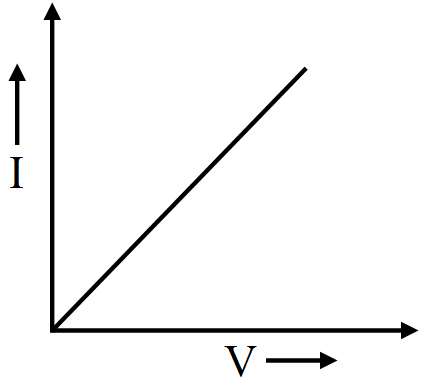
What kind of graph is obtained by plotting values of V and I Why?
✓
Answer
The V - I graph (at constant temperature) for a conductor following the Ohm’s law is a straight line with a positive slope.
The slope of the graph with current on the vertical axis and potential difference on the horizontal axis represents the Resistance of the material of the conductor.
Need a full question paper?
Generate a complete, print-ready paper with questions like this in minutes — across 16+ boards, with answer keys.