On sports day, $120$ children participated in the sprint, $60$ children participated in the javelin throw, $30$ children participated in the shot put throw and $30$ children participated in the discus throw. Draw a pie chart to represent the data.
View full solution →Question types
CH - 14. Data Handling question types
11 questions across 3 question groups — pick any mix to generate a MATH-MAGIC paper with step-by-step answer keys.
11
Questions
3
Question groups
5
Question types
01
Answer the following : (2 mark each)
4 Q→02Answer the following : (3 mark each)
4 Q→03Answer the following : (4 mark each)
3 Q→Sample Questions
CH - 14. Data Handling questions
One sample from each question group in this chapter. Select any group above to see the full set with answer keys.
Out of $112$ children, $56$ like chocolate, $28$ like butterscotch, $14$ like strawberry and $14$ like vanilla flavoured ice cream. Draw a pie chart to represent the data.
View full solution →A fruit seller sold $60$ bananas, $30$ mangoes, $15$ papayas and $15$ oranges. Draw a pie chart to represent the data.
View full solution →In an amusement park, out of $100$ people, $25$ wore green, $50$ wore red and $25$ wore blue dress. Draw a pie chart to represent the data.
View full solution →The pie chart represents the ways in which Aaradhya spends her pocket money. Answer the following questions based on it, if Aaradhya gets $500$ as pocket money.
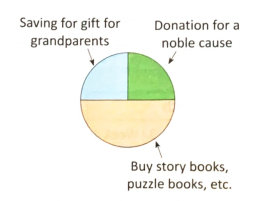
$a.$ How much money is saved by her for grandparents' gift every month?
$b.$ What fraction of the pocket money is spent in donation?
$c.$ How much amount does she spend in buying books?
View full solution →$a.$ How much money is saved by her for grandparents' gift every month?
$b.$ What fraction of the pocket money is spent in donation?
$c.$ How much amount does she spend in buying books?
Students of Class $IV$ of a school enjoy eating different fruits. The data below lists the fruits and the number of children who like that fruit. Draw a bar graph to represent the data. Also frame your own questions.
Write the benefits of eating fruits every day.
View full solution →| Mango | Orange | Peach | Grapes | Banana |
| $22$ | $24$ | $18$ | $10$ | $8$ |
The bar graph shows the number of appliances sold by a shop in a month. Read the bar graph and answer the questions.
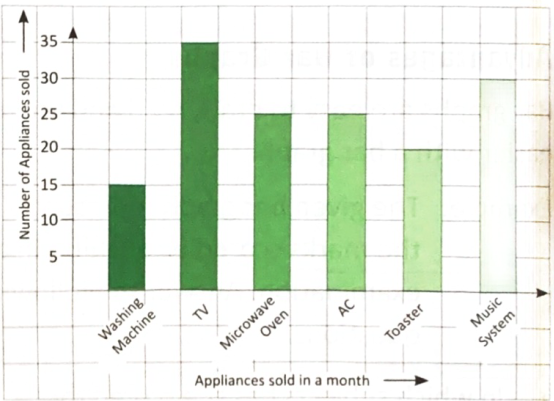
$a.$ Which appliance was sold in maximum number?
$b.$ Which two appliances were sold in equal numbers and how many of these were sold?
$C.$ How many more music systems were sold than toasters?
View full solution →$a.$ Which appliance was sold in maximum number?
$b.$ Which two appliances were sold in equal numbers and how many of these were sold?
$C.$ How many more music systems were sold than toasters?
The bar graph shows how Rohan spends his time on a normal day. Answer the questions based on the given data.
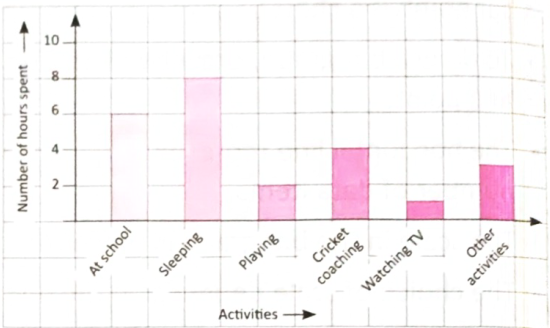
$a.$ On which activity does Rohan spend the maximum number of hours?
$b.$ How many total hours does Rohan spend in sleeping and at school?
$C.$ What is the difference between the number of hours spent in playing and the number of hours spent in watching $TV?$
View full solution →$a.$ On which activity does Rohan spend the maximum number of hours?
$b.$ How many total hours does Rohan spend in sleeping and at school?
$C.$ What is the difference between the number of hours spent in playing and the number of hours spent in watching $TV?$
A food corner recorded the number of food items that were sold on a particular day.
The bar graph shows the data.
Read the bar graph and answer the following questions.
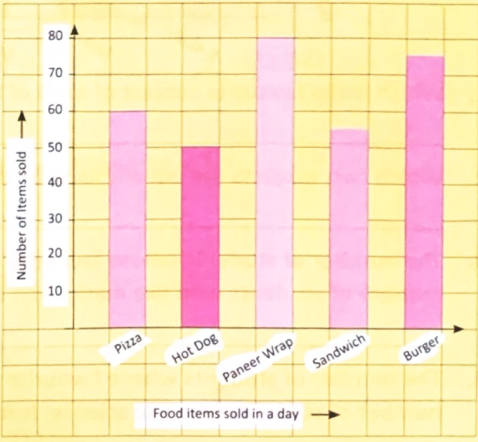
$a.$ How many sandwiches were sold?
$b.$ Which item was sold the most?
$C.$ How many burgers were sold?
$d.$ Which item was sold the least?
View full solution →The bar graph shows the data.
Read the bar graph and answer the following questions.
$a.$ How many sandwiches were sold?
$b.$ Which item was sold the most?
$C.$ How many burgers were sold?
$d.$ Which item was sold the least?
Favourite $TV$ channels of a group of children are represented on the bar graph. Answer the questions based on it.
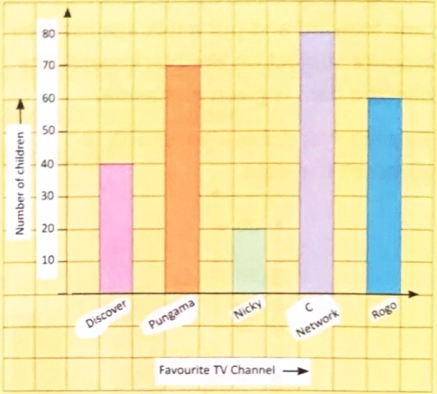
$a.$ How many children like to watch Rogo?
$b.$ Which channel is watched the most by the children?
$c.$ How many more children like Pungama than Nicky?
$d.$ Which channel is watched by $40$ children?
$e.$ Which $TV$ channel is least watched by the children?
View full solution →$a.$ How many children like to watch Rogo?
$b.$ Which channel is watched the most by the children?
$c.$ How many more children like Pungama than Nicky?
$d.$ Which channel is watched by $40$ children?
$e.$ Which $TV$ channel is least watched by the children?
The given pie chart represents the favourite animals of a group of children. State whether the following are true or false based on the given data.
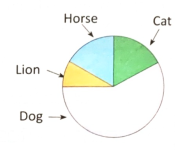
$a.$ The least number of children like lion.
$b.$ The horse is the favourite animal of most of the children.
$C.$ More children like dogs than cats.
$d.$ More children like lions, horses and cats put together than dogs.
View full solution →$a.$ The least number of children like lion.
$b.$ The horse is the favourite animal of most of the children.
$C.$ More children like dogs than cats.
$d.$ More children like lions, horses and cats put together than dogs.
Generate a CH - 14. Data Handling paper free
Pick question groups from the list above, set marks and difficulty, and export a branded PDF with step-by-step answer keys. First 3 chapters free — no signup.