Question 14 Marks
A food corner recorded the number of food items that were sold on a particular day.
The bar graph shows the data.
Read the bar graph and answer the following questions.
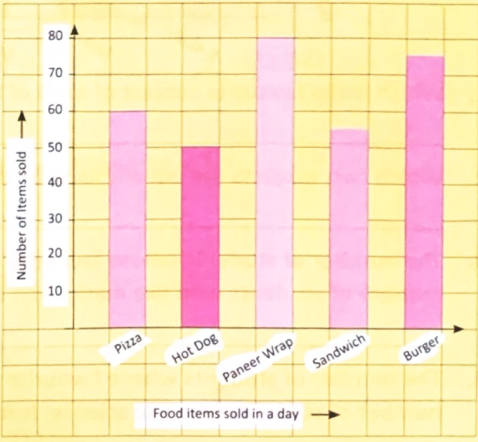
$a.$ How many sandwiches were sold?
$b.$ Which item was sold the most?
$C.$ How many burgers were sold?
$d.$ Which item was sold the least?
The bar graph shows the data.
Read the bar graph and answer the following questions.
$a.$ How many sandwiches were sold?
$b.$ Which item was sold the most?
$C.$ How many burgers were sold?
$d.$ Which item was sold the least?
Answer
View full question & answer→self