Question 14 Marks
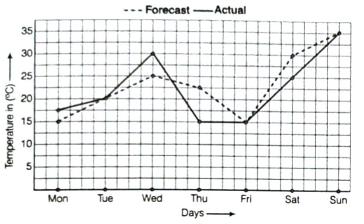
The following graph shows the temperature forecast and the actual temperature for each day of a week.
(i) On which days was the forecast temperature the same as the actual temperature?
(ii) What was the maximum forecast temperature during the week?
(iii) What was the minimum actual temperature during the week?
(iv) On which day did the actual temperature differ the most from the forecast temperature?
Answer
View full question & answer→(i) From the given graph, it is clear that the forecast temperature was the same as the actual temperature on Tuesday, Friday and Sunday. (This is indicated by the point at which both graphs meet).
(ii) From the given graph, we can say that the maximum forecast temperature during the week was $35^{\circ} C$
(iii) From the given graph, we can say that the minimum actual temperature during the week was $15^{\circ} C$
(iv)
Since, the maximum difference between temperature $7.5^{\circ} C$
Hence, the actual temperature differed the most from the forecast temperature on Thursday.
(ii) From the given graph, we can say that the maximum forecast temperature during the week was $35^{\circ} C$
(iii) From the given graph, we can say that the minimum actual temperature during the week was $15^{\circ} C$
(iv)
| Days | Difference between the actual and forecast temperature |
| Monday | $17.5-15=2.5^{\circ} C$ |
| Tuesday | $20-20=0^{\circ} C$ |
| Wednesday | $30-25=5^{\circ} C$ |
| Thursday | $22.5-15=7.5^{\circ} C$ |
| Friday | $15-15=0^{\circ} C$ |
| Saturday | $30-25=5^{\circ} C$ |
| Sunday | $35-35=0^{\circ} C$ |
Hence, the actual temperature differed the most from the forecast temperature on Thursday.