Question 14 Marks
The graph given below, shows the marks obtained out of 10 by Sonia in two different tests. Study the graph and answer the questions that follow.
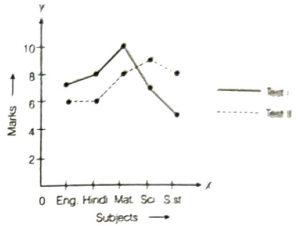
(i) What information is represented by the axes?
(ii) In which subject did she score the highest in test I?
(iii) In which subject did she score the least in test II?
(iv) In which subjects did she score the same marks in both the tests?
(i) What information is represented by the axes?
(ii) In which subject did she score the highest in test I?
(iii) In which subject did she score the least in test II?
(iv) In which subjects did she score the same marks in both the tests?
Answer
View full question & answer→(i) Subjects and marks obtained (out of 10) by Sonia in two tests.
(ii) In Maths, she scored the highest in test I.
(iii) In English and Hindi, she scored the least in test II.
(iv) In both the test, she didn't scored same marks in any of the subjects.
(ii) In Maths, she scored the highest in test I.
(iii) In English and Hindi, she scored the least in test II.
(iv) In both the test, she didn't scored same marks in any of the subjects.