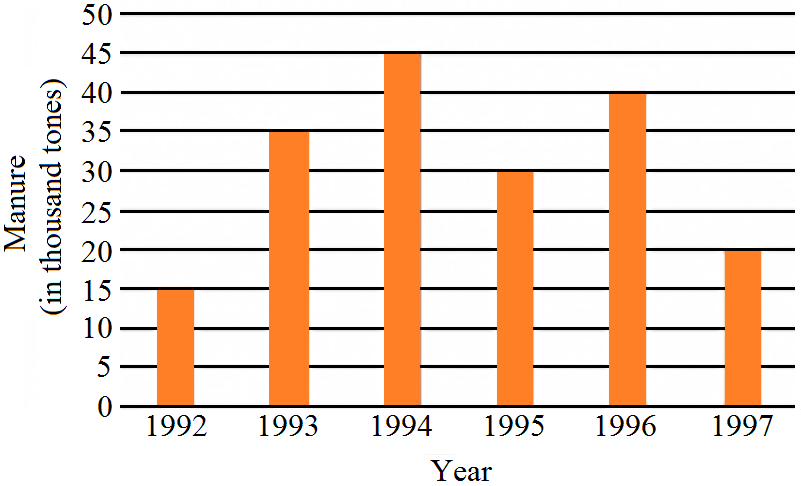
Question 15 Marks
The population of Delhi State in different census years is as given below:
Represent the above information with the help of a bar graph.
| Census year | 1961 | 1971 | 1981 | 1991 | 2001 |
| Population in Lakhs | 30 | 55 | 70 | 110 | 150 |
Answer
View full question & answer→While drawing a bar graph, we keep in mind that:
The width of the bars should be uniform throughout.
The gap between any two bars should be uniform throughout.
Bars may be either horizontal or vertical.
To represent the given data by a vertical bar graph, we first draw horizontal and vertical axes.
Let us consider that the horizontal and vertical axes represent the years and the population in lakhs respectively. We have to draw 5 bars of different heights given in the table. At first, we mark 5 points in the horizontal axis at equal distances and erect rectangles of the same width at these points. The heights of the rectangles are proportional to the population in lakhs. The vertical bar graph of the given data is following:
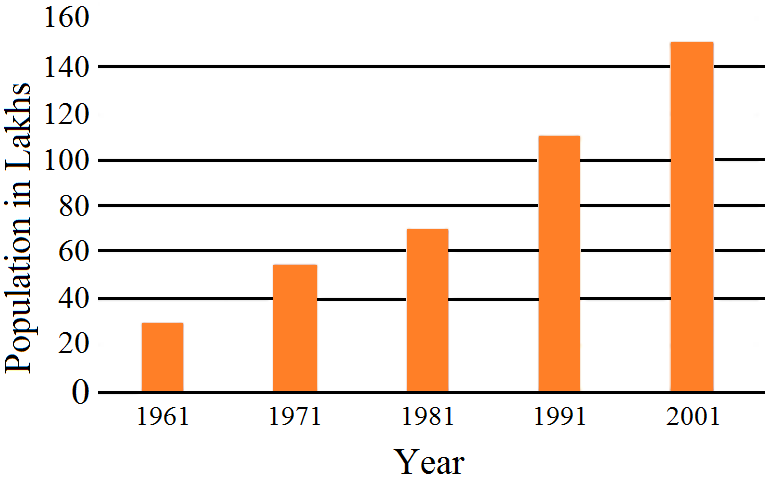
Note that each bar is of the same width and the gap between them is uniform. Make sure that the width of the bars and the gap between them should not be necessarily same.
The width of the bars should be uniform throughout.
The gap between any two bars should be uniform throughout.
Bars may be either horizontal or vertical.
To represent the given data by a vertical bar graph, we first draw horizontal and vertical axes.
Let us consider that the horizontal and vertical axes represent the years and the population in lakhs respectively. We have to draw 5 bars of different heights given in the table. At first, we mark 5 points in the horizontal axis at equal distances and erect rectangles of the same width at these points. The heights of the rectangles are proportional to the population in lakhs. The vertical bar graph of the given data is following:
Note that each bar is of the same width and the gap between them is uniform. Make sure that the width of the bars and the gap between them should not be necessarily same.
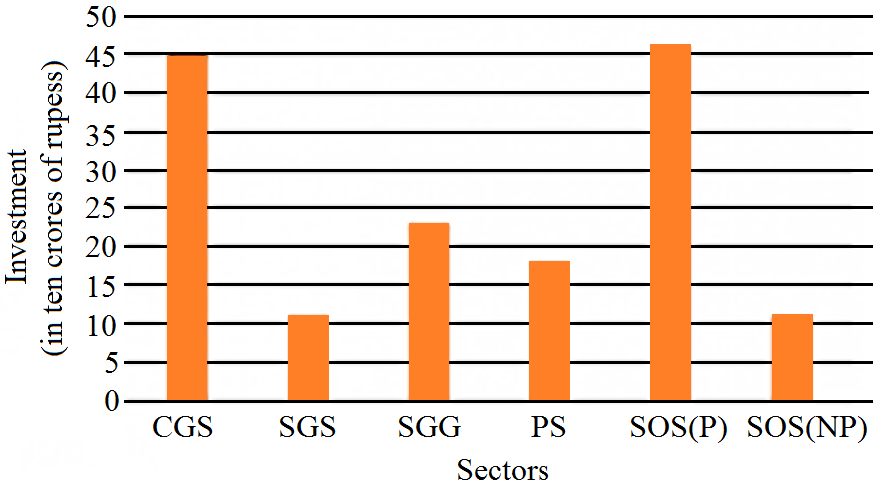 The short forms used in the graph are:
 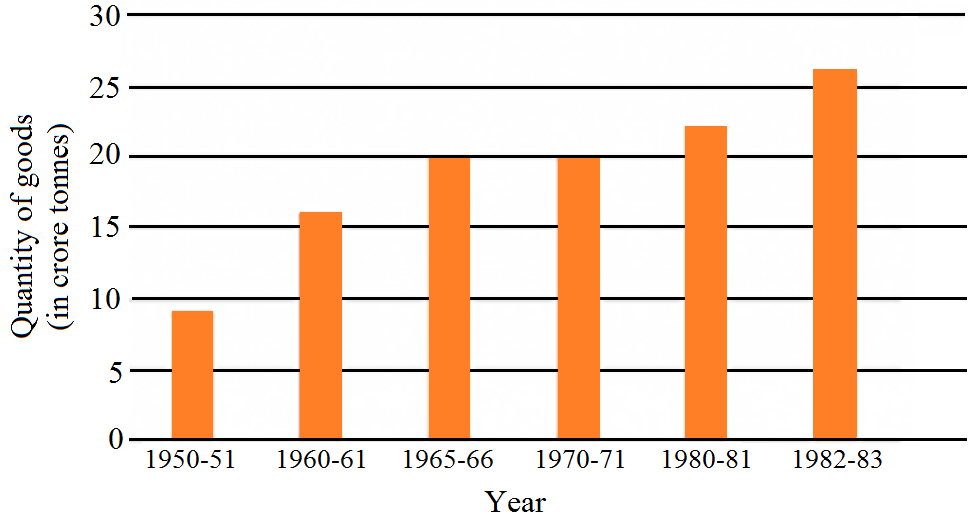 It is seen from the bar graph that the quantity of goods carried in the years 1950–51 and 1965–66 are 20 Crores tonnes and 9 Crores tonnes. Clearly 20 is more than 2 multiplied by 9. Hence, the statement is true.
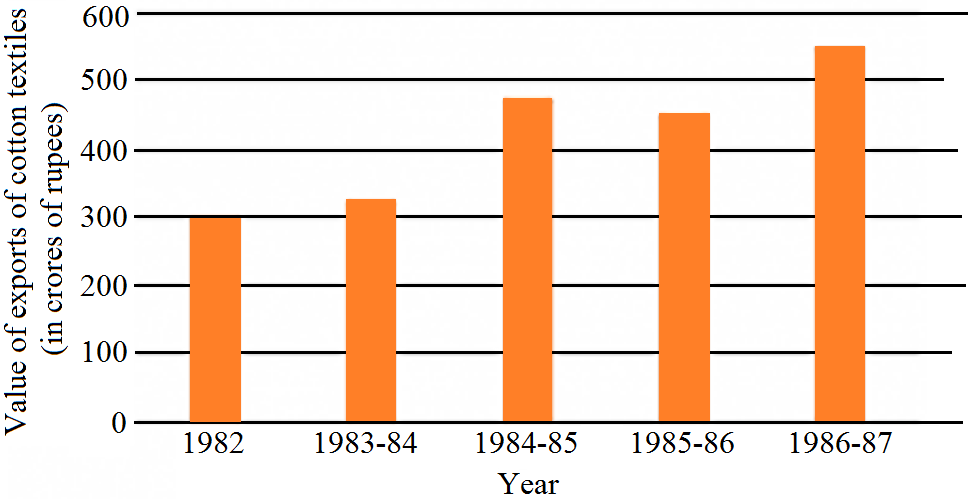 The export increases in the years 1983–84, 1984–85 and 1986–87. Now,
 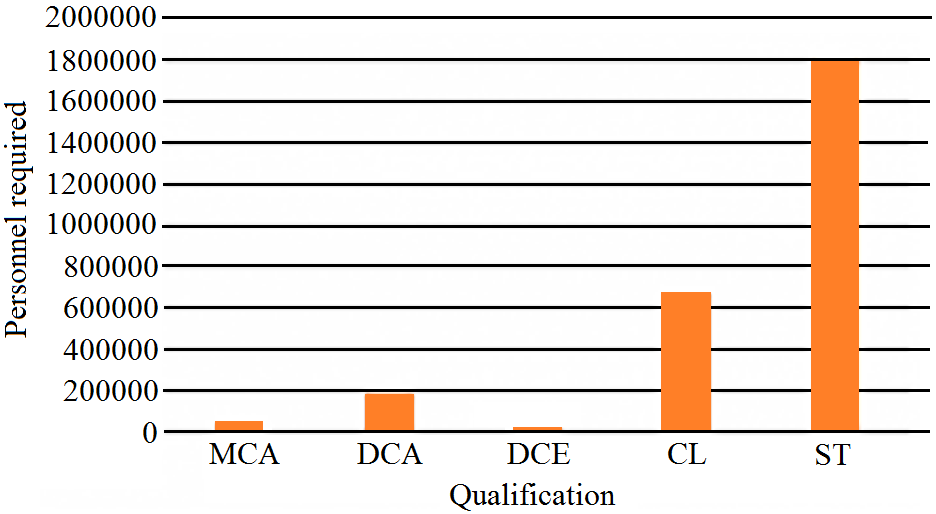 It is seen from the bar graph that the height of the 3ffl bar from the left is least, which is corresponding to DCE. Hence, the requirement is least in DCE.