Questions

Case study (4 Marks)

🎯

Test yourself on this topic

4 questions · timed · auto-graded

Question 14 Marks
Read the following bar graph and answer the following questions:
Image
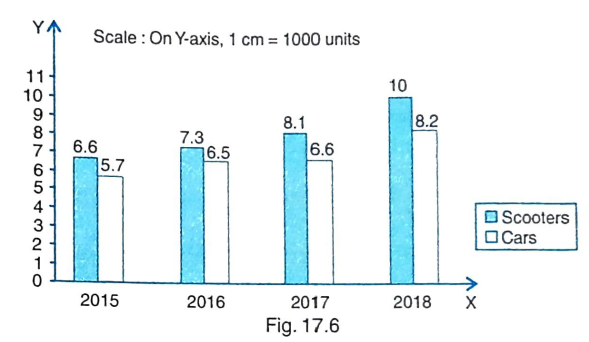
(i) In which year was the difference between the sales of the scooters and the sales of cars the least?
(a) 2015(\quad$ (b) 2016(\quad$ (c) 2017(\quad$ (d) 2018
(ii) Total number of vehicles (scooters and cars) sold in the year 2015 and 2016 was
(a) 26,100$\quad$ (b) 28,500$\quad$ (c) 25,100$\quad$ (d) 27,500
(iii) The maximum difference between the sales of scooters and cars, in any year, in the given period was
(a) 1500$\quad$ (b) 1700$\quad$ (c) 1800$\quad$ (d) 2000
(iv) The total number of scooters sold in the four years was
(a) 26,000$\quad$ (b) 27,000$\quad$ (c) 31,000$\quad$ (d) 32,000
(v) The ratio between the total number of vehicles sold (scooters and cars) in the year 2016 and that in the year 2018.
(a) 41:46$\quad$ (b) 69:91$\quad$ (c) 147:182$\quad$ (d) 46:49
Answer
(i) (b) (ii) (a) (iii) (c) (iv) (d) (v) (b)
View full question & answer
Question 24 Marks
Population census in India is conducted every 10 years. The first complete census was taken in 1881 and the 15th decennial census was taken in 2011. The 16th decennial census was to be conducted in 2021 but due to COVID it will be taken in 2022. The data obtained from the census of a town has been represented by a bar graph shown in Fig. 17.2. It represents the number of persons in various age groups in the town. Observe the bar graph and answer the following questions:
Image

(i) What is the total number of persons living in the town in the age-groups 10-15 and 60 - 65?
(a) 2000$\quad$ (b) 2200$\quad$ (c) 2100$\quad$ (d) 1900
(ii) How many persons are more in the age-group 10 - 15 than in the age group 30-35?
(a) 200$\quad$ (b) 250$\quad$ (c) 300$\quad$ (d) 350
(iii) What is the total population of the town?
(a) 6700$\quad$ (b) 6400$\quad$ (c) 7700$\quad$ (d) 6600
(iv) What is the number of persons in the age-group 60-65?
(a) 900$\quad$ (b) 750$\quad$ (c) 850$\quad$ (d) 800
Answer
(i) (b): Total number of persons in the age-groups 10-15 and 60-65 = 1400+800 = 2200
(ii) (c): Number of persons in the age group 10 - 15 years = 1400 Number of persons in the age group 30-35 years = 1100 ∴ 300 persons are more in the age-group 10 - 15 years.
(iii) (a): Total population of the town = 1400+1200+1100+1000+900+800 + 300 = 6700
(iv) (d): Number of persons in the age group 60 - 65 years = 800
View full question & answer
Question 34 Marks
Following bar graph represents the sales of cold drinks of two companies A and B from 2015 to 2018.
Image
Read the above bar graph and answer the following questions:
(i) The year in which the difference between the sales of two companies was highest, was
(a) 2018$\quad$ (b) 2015$\quad$ (c) 2016$\quad$ (d) 2017$\quad$
(ii) Total sales of A and B in the year 2016 was
(a) 1,160,000 units$\quad$ (b) 1,270,000 units$\quad$ (c) 1,380,000 units$\quad$ (d) 1,490,000 units
(iii) The minimum difference between the sales of company A and B in any year in the given period was
(a) 90,000 units$\quad$ (b) 70,000 units$\quad$ (c) 50,000 units$\quad$ (d) 30,000 units
(iv) In which year was the sales of company B more than the sales of company A?
(a) 2015$\quad$ (b) 2016$\quad$ (c) 2017$\quad$ d) 2018
(v) The ratio of the total sales in the year 2017 and that in 2018 was
a) 107:145$\quad$ (b) 29:36$\quad$ (c) 127: 145$\quad$ (d) 107: 127
Answer
(i) (a), (ii) (b), (iii) (b) ,(iv) (d) ,(v) (c)
View full question & answer
Question 44 Marks
A healthcare survey was done by the State Health and Family Welfare Care Board of the State of Punjab. The data is collected by forming age groups i.e. 10-15, 20-25, 30-35, 40-45, 50-55, 60-65, 70-75. The overall data from a town is given below in the form of a bar graph. Read the data carefully and answer the question that follow:
Image
(i)How many persons are more in the age group 10 - 15 than in the age group 30 - 35?
(ii)What is the age group of exactly 1200 persons living in the town?
(iii)What is the percentage of the youngest age group persons over those in the oldest age group?
(iv) What is the total population of the town?
Answer
(i) 300 (ii) 20-25 (iii) 21.42% (iv) 6700
View full question & answer
Case study (4 Marks) - Maths STD 9 Questions - Vidyadip