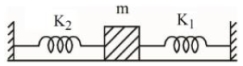
A mass $m$ is attached to two springs as shown in figure. The spring constants of two springs are $K _1$ and $K _2$. For the frictionless surface, the time period of oscillation of mass $m$ is
JEE MAIN 2023, Medium
Download our app for free and get started
On displacing $m$ to right by $x$
$F =-\left( k _1 x+ k _2 x \right)=-\left( k _1+ k _2\right) x$
$a =\frac{ F }{ m }=-\left(\frac{ k _1+ k _2}{ m }\right) x =-\omega^2 x$
$\therefore \omega=\sqrt{\frac{ k _1+ k _2}{ m }} \Rightarrow T=\frac{2 \pi}{\omega}=2 \pi \sqrt{\frac{ m }{ k _1+ k _2}}$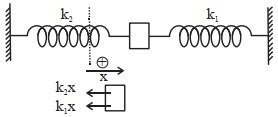

Download our appand get started for free
Experience the future of education. Simply download our apps or reach out to us for more information. Let's shape the future of learning together!No signup needed.*
Similar Questions
- 1A particle execute $S.H.M.$ along a straight line. The amplitude of oscillation is $2 \,cm$. When displacement of particle from the mean position is $1 \,cm$, the magnitude of its acceleration is equal to magnitude of its velocity. The time period of oscillation is ........View Solution
- 2View SolutionA simple pendulum is set into vibrations. The bob of the pendulum comes to rest after some time due to
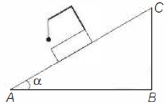
- 3A simple pendulum is attached to a block which slides without friction down an inclined plane $A B C$ having an angle of inclination $\alpha$ as shown below. While the block is sliding down the pendulum oscillates in such a way that at its mean position the direction of the string isView Solution
- 4Displacement-time equation of a particle executing $SHM$ is $x\, = \,A\,\sin \,\left( {\omega t\, + \,\frac{\pi }{6}} \right)$ Time taken by the particle to go directly from $x\, = \, - \frac{A}{2}$ to $x\, = \, + \frac{A}{2}$ isView Solution
- 5Two simple pendulums whose lengths are $100 cm$ and $121 cm$ are suspended side by side. Their bobs are pulled together and then released. After how many minimum oscillations of the longer pendulum, will the two be in phase againView Solution
- 6The motion of a mass on a spring, with spring constant ${K}$ is as shown in figure. The equation of motion is given by $x(t)= A sin \omega t+ Bcos\omega t$ with $\omega=\sqrt{\frac{K}{m}}$ Suppose that at time $t=0$, the position of mass is $x(0)$ and velocity $v(0)$, then its displacement can also be represented as $x(t)=C \cos (\omega t-\phi)$, where $C$ and $\phi$ areView Solution
- 7The oscillation of a body on a smooth horizontal surface is represented by the equation $x= Acos$$\omega t$View Solution
where $x=$ displacement at time $t$
$\omega =$ frequency of oscillation
Which one of the following graphs shows correctly the variation $a$ with $t$ ?
Here $a=$ acceleration at time $t$
$T=$ time period
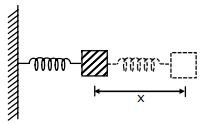
- 8The period of oscillation of a mass $M$ suspended from a spring of negligible mass is $T$. If along with it another mass $M$ is also suspended, the period of oscillation will now beView Solution
- 9The displacement of a particle varies with time as $x = 12\sin \omega t - 16{\sin ^3}\omega t$ (in $cm$). If its motion is $S.H.M.$, then its maximum acceleration isView Solution
- 10A mass at the end of a spring executes harmonic motion about an equilibrium position with an amplitude $A.$ Its speed as it passes through the equilibrium position is $V.$ If extended $2A$ and released, the speed of the mass passing through the equilibrium position will beView Solution