Question
Construct an angle of 90° and bisect it.
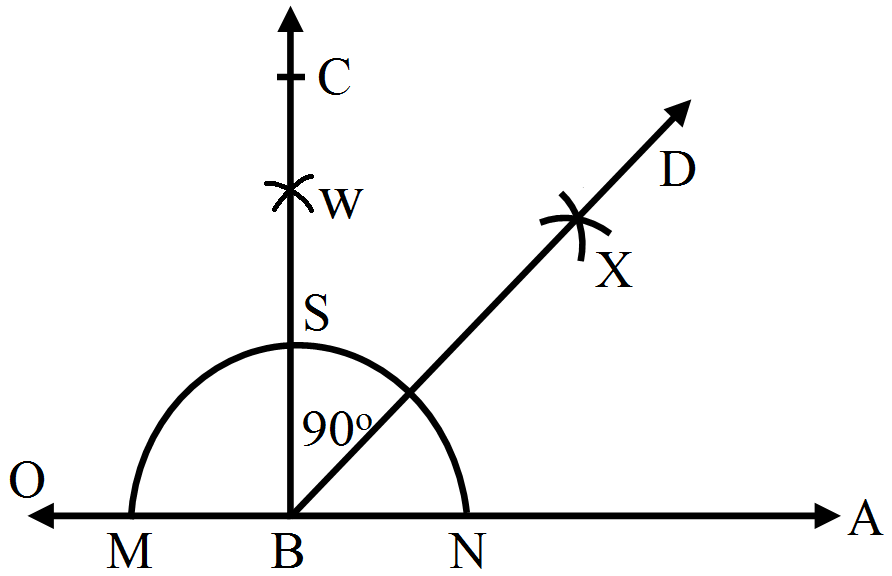
Answer


Construction steps:
  1. Draw a line OA.
  2. Take a point B on OA. With B as the centre and any convenient radius, draw an arc cutting OA at M and N.
  3. With N as the centre and radius more than half of MN, draw an arc.
  4. With M as the centre and the same radius as before, draw another arc to cut the previous arc at W.
  5. Draw WB, meeting the arc at S. Produce it to C.
$\angle\text{ABC}$ is the required angle of 90° $\angle\text{ABC}$ is the required angle of 90°.
  1. With S as the centre and radius more than half of SN, draw an arc.
  2. With N as centre and the same radius as in step (6), draw another arc, cutting the previously drawn arc at point X.
  3. Draw BX and produce it to point D. Ray BD is the angle bisctor of $\angle\text{ABC}.$ Ray BD is the angle bisctor of $\angle\text{ABC}.$ Ray BD is the angl bisctor of $\angle\text{ABC}.$ Ray BD is the angle bisctor of $\angle\text{ABC}.$

Need a full question paper?

Generate a complete, print-ready paper with questions like this in minutes — across 16+ boards, with answer keys.

Start Generating Free

Similar questions

Using a pair of compasses construct the following angles:
60°
Match the following statements:
  Column A   Column B
i Line segment has a at a point
ii Two segments may intersect b if they have equal lengths
iii Two segments are congruent c two end-point
iv Line segment is d portion of a line
Measure of the angle Type of the angle
i. 180° a. Zero angle
ii. 240° b. Straight angle
iii. 360° c. Reflex angle
iv. d. Complete angle
The following data gives the amount of mature (in thousand tones) manufactured by a company during some years:
Year
1992
1993
1994
1995
1996
1997
Manure (in thousand tonnes)
15
35
45
30
40
20
  1. Represent the above data with the help of a bar graph.
  2. Indicate will the help of the bar graph the year in which the amount of manure manufactured by the company was maximum.
  3. Choose the correct alternative.
The consecutive years during which there was a maximum decrease in manure production are:
  1. 1994 and 1995
  2. 1992 and 1993
  3. 1996 and 1997
  4. 1995 and 1996
Draw a line AB and take two points C and E on opposite sides of AB. Through C, draw $\text{CD}\perp\text{AB}$ and through E draw $\text{EF}\perp\text{AB}.$ ruler and set-squares.
Given below is the bar graph indicating the marks obtained out of 50 in mathematics paper by 100 students. Read the bar graph and answer the following questions:
  1. It is decidec to distribute work books on mathematics to the students obtaining less than 20 marks, giving one workbook to each of such students. If a work book costs ₹ 5, what sum is required to buy the work books?
  2. Every student belonging to the highest mark group is entitled to get a prize of ₹ 10. How much amount of money is required for distributing the prize money?
  3. Every student belonging to the lowest mark-group has to solve 5 problems per day. How many problems, in all, will be solved by the students of this group per day?
  4. State whether true or false.
  1. 17% students have obtained marks ranging from 40 to 49.
  2. 59 students have obtained marks ranging from 10 to 29.
  1. What is the number of students getting less than 20 marks?
  2. What is the number of students getting more than 29 marks?
  3. What is the number of students getting marks between 9 and 40?
  4. What is the number, of students belonging to the highest mark group?
  5. What is the number of students obtaining more than 19 marks?
Using protractor, draw a right angle. Bisect it to get an angle of measure 45°.
The following data gives the production of food grains (in thousand tones) for some years:
Years
1995
1996
1997
1998
1999
2000
Production (in thousand tonnes)
120
150
140
180
170
190
Represent the above data with the help of a bar graph.
Draw an angle and label it as $\angle\text{BAC}.$ Draw its bisector ray AX and take a point P on it. From P draw line segments PM and PN, such that $\text{PM}\perp\text{AB}$ and $\text{PN}\perp\text{AC},$ where M and N are respectively points on rays AB and AC. Measure PM and PN. Are the two lengths equal?
The following table shows the number of maruti cars sold by five dealers in a particular month:
Dealer
Saya
Bagga Links
D.D Motors
Bhasin Motor
Competent Motors
Cars Sold
60
40
20
15
10
Represent the above information by a pictograph.