Question
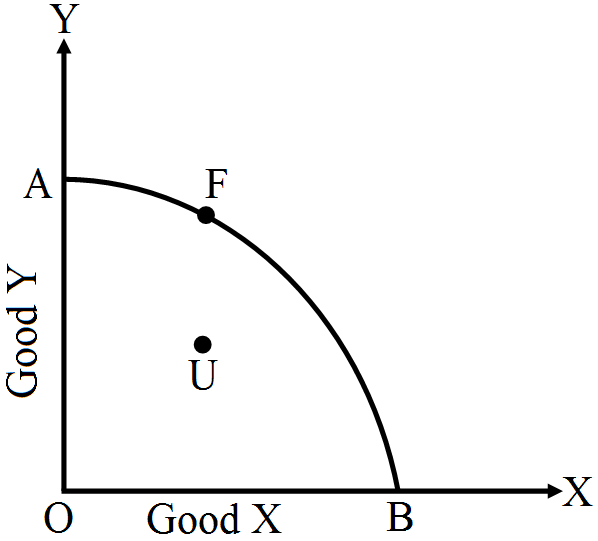
Does production take place only on the PP curve?

Answer

The given statement may or may not be correct. If the given resources are fully and efficiently used in an economy, the production takes place on the PP curve. But if the resources in the economy are underutilised or inefficiently utilised or both, the production takes place inside the PP curve. The given figure illustrates the point.
On point F, and for that matter on any point on the production possibility curve OAB, the resources are fully and efficiently employed. On point U, below the PP curve or any other point, but below the PP curve, the resources are either underutilised or inefficiently utilised or both. Any point below the PP curve thus highlights the problem of unemployment and inefficiency in the economy.

Need a full question paper?

Generate a complete, print-ready paper with questions like this in minutes — across 16+ boards, with answer keys.

Start Generating Free

Similar questions

Perfectly competitive firms are considered as more efficient than monopolies. Do you agree?
A consumer buys 80 units of a good at a price of Rs. 5 per unit. Suppose price elasticity of demand is (-)2. At what price will he buy 64 units?
State the relation between marginal product and average product. Show this relation in a diagram.
Suppose the demand and supply curve of commodity X in a perfectly competitive market are given by:$\text{q}^\text{D}=700-\text{p}$
$\text{q}^\text{s}=500+3\text{p for p}\geq15$
$=0\text{ for }0\leq\text{p}<15$
Assume that the market consists of identical firms. Identify the reason behind the market supply of commodity X being zero at any price less than $Rs. 15$. What will be the equilibrium price for this commodity? At equilibrium, what mquantity of X will be produced?
When price of a good rises from ₹ 8 per unit to ₹10 per unit, producer supplies 40 units more. Price elasticity of supply is 2. What is the quantity supplied before the price change? Calculate.
Production function.
Differentiate between substitute goods and complementary goods.
Consider a hypothetical demand and supply schedule of a commodity as given below:
Price of X (₹)
Demand (Units)
Supply (Units)
2 100 20
4 80 40
6 60 60
8 40 80
10 20 100
Draw a diagram and find the equilibrium price and equilibrium quantity.
How does the budget line change if the consumer's income increases to Rs $40$ but the prices remain unchanged?
Find maximum profit situation from the table:
Output (in units) TR (₹) TC (₹)
1 50 60
2 60 65
3 68 68
4 70 60
5 75 75
6 80 95
Calculate:
  1. Output level showing loss.
  2. Output level showing break-even point.
  3. Output level showing maximum profit.