i. Analytical chemistry often involves deducing some relation between two or more properties of matter under study.
ii. For example, the relation between temperature and volume of a given amount of gas.
iii. A set of experimentally measured values of volume and temperature of a definite mass of a gas upon plotting on a graph paper appears as in the figure below:
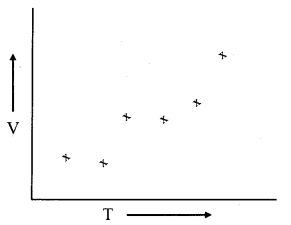
iv. When the points are directly connected, a zig zag pattern results as shown below:
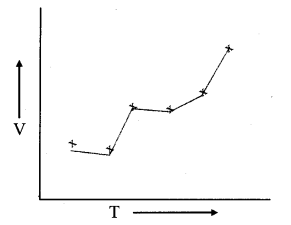
From the above pattern, no meaningful result can be deduced.
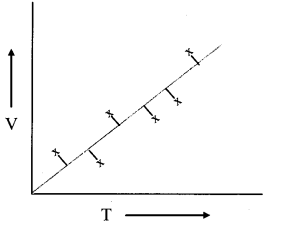
v. A smooth curve (or average curve) passing through these points can be drawn as shown below. This straight line is consistent with the V ∝ T .
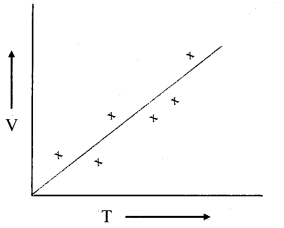
vi. While fitting the points into a smooth curve, all the plotted points should be evenly distributed. This can be verified mathematically, by drawing a perpendicular from each point to the curve. The perpendicular represents deviation of each point from the curve. Take sum of all the perpendiculars on side of the line and sum of all the perpendiculars on another side of the line separately. If the two sums are equal (or nearly equal), the curve drawn shows the experimental points in the best possible representation