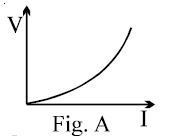
The variation of current $(I)$ and voltage $(V)$ is as shown in figure $A$. The variation of power $P$ with current $I$ is best shown by which of the following graph
Medium
Download our app for free and get started
Power $\mathrm{P}$ in terms of $\mathrm{v}$ is $P=\frac{V^{2}}{R}$ and in terms of $\mathrm{I}$ is $P=\left(I^{2}\right) \times R$
Hence the shape of the curve will be similar but with a different slope.
Therefore option $B$ is correct.

Download our appand get started for free
Experience the future of education. Simply download our apps or reach out to us for more information. Let's shape the future of learning together!No signup needed.*
Similar Questions
- 1The thermo $e.m.f.$ of a thermo-couple is $25\,\mu V{/^o}C$ at room temperature. A galvanometer of $40\, ohm$ resistance, capable of detecting current as low as ${10^{ - 5}}\,A,$ is connected with the thermocouple. The smallest temperature difference that can be detected by this system is ................ $^oC$View Solution
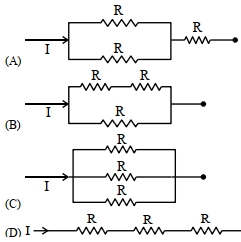
- 2View SolutionConsider four circuits shown in the figure below. In which circuit power dissipated is greatest (Neglect the internal resistance of the power supply)
- 3A resistor dissipates $192\, {J}$ of energy in $1\, {s}$ when a current of $4\, {A}$ is passed through it. Now, when the current is doubled, the amount of thermal energy dissipated in $5 \,{s}$ in $.....\,J.$View Solution
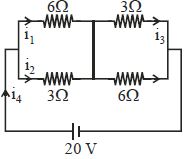
- 4View SolutionIn the below circuit the current in each resistance is
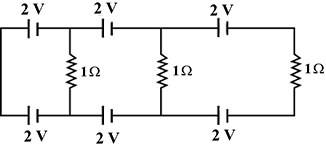
- 5View SolutionDiagram shows a circuit diagram choose incorrect statement
- 6In a conductor, if the number of conduction electrons per unit volume is $8.5 \times 10^{28}\, m^{-3}$ and mean free time is $25\,fs$ (femto second), its approximate resistivity is $\left( {{m_e} = 9.1 \times {{10}^{ - 31}}\,kg} \right)$View Solution
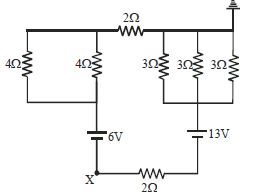
- 7Find potential at point $'x'$ in given circuit ............... $V$View Solution
- 8The electric field $E$, current density $J$ and conductivity $\sigma$ of a conductor are related asView Solution
- 9View SolutionAll of the following statements are true except
- 10Different combination of $3$ resistors of equal resistance $R$ are shown in the figures.View Solution
The increasing order for power dissipation is: