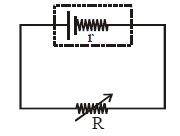
Which of the following graphs represent the variation of power loss in the external load with external resistance $R$?
Medium
Download our app for free and get started
Power loss through $\mathrm{R}$ resistance is $=\mathrm{l}^{2} \mathrm{R}$
On increasing $\mathrm{R}$, curront will decrease, so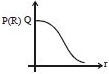

Download our appand get started for free
Experience the future of education. Simply download our apps or reach out to us for more information. Let's shape the future of learning together!No signup needed.*
Similar Questions
- 1If $n,\,e,\,\tau $ and $m$ respectively represent the density, charge relaxation time and mass of the electron, then the resistance of a wire of length $l$ and area of cross-section $A$ will beView Solution
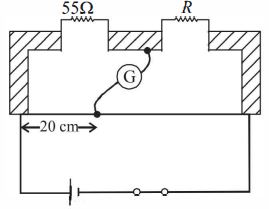
- 2Shown in the figure below is a meter-bridge set up with null deflection in the galvanometer. The value of the unknown resistor $R$ is ............. $\Omega$View Solution
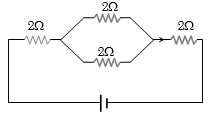
- 3The equivalent resistance of the circuit shown in the figure is ............. $\Omega$View Solution
- 4The internal resistance of a primary cell is $4\, ohm$. It generates a current of $0.2\, amp$ in an external resistance of $21\, ohm$. The rate at which chemical energy is consumed in providing the current is .............. $J/s$View Solution
- 5Thousand cells of same emf $E$ and same internal resistance $r$ are connected in series in same order without an external resistance. The potential drop across $399$ cells is found to be ......... $E$View Solution
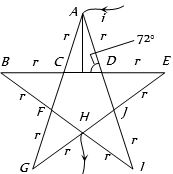
- 6In the following star circuit diagram (figure), the equivalent resistance between the points $A$ and $H$ will be ..............$r$View Solution
- 7In a potentiometer experiment, it is found that no current passes through the galvanometer when the terminals of the cell are connected across $52\ cm$ of the potentiometer wire. If the cell is shunted by a resistance of $ 5\,\Omega$, a balance is found when the cell is connected across $40\ cm$ of the wire. Find the internal resistance of the cell ........... $\Omega$View Solution
- 8Two bulbs are working in parallel order. Bulb $A$ is brighter than bulb $B$. If ${R_A}$ and ${R_B}$ are their resistance respectively thenView Solution
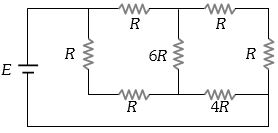
- 9A battery of internal resistance $4$ $\Omega$ is connected to the network of resistances as shown. In order to give the maximum power to the network, the value of $R$ (in $\Omega $) should beView Solution
- 10The charge flowing through a resistor $R$ varies with time $t$ as $Q = 3t -6t^2.$ The heat produced in $R$ till the current in it becomes zero isView Solution