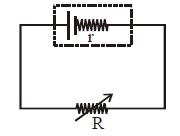
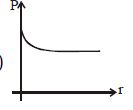
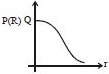
Which of the following graphs represent the variation of power loss in the external load with external resistance $R$?
- A
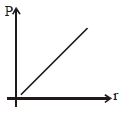
- B
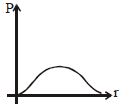
- C
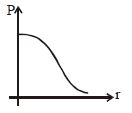
- D
Medium


Download our appand get started for free
Experience the future of education. Simply download our apps or reach out to us for more information. Let's shape the future of learning together!No signup needed.*
Similar Questions
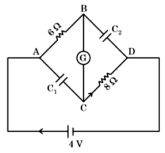
- 1In this figure the resistance of the coil of galvanometer $G$ is $2\,\Omega$. The emf of the cell is $4\,V$. The ratio of potential difference across $C_1$ and $C_2$ is:View Solution
- 2A potentiometer wire, $10\,m$ long, has a resistance of $40\,\Omega $. It is connected in series with a resistance box and a $2\,V$ storage cell. If the potential gradient along the wire is $0.1\,m\,V/cm$, the resistance unplugged in the box is .............. $\Omega$View Solution
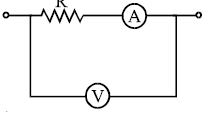
- 3In the circuit shown the resistance of voltmeter is $10,000\, ohm$ and that of ammeter is $20\,ohm$. The ammeter reading is $0.10\,Amp$ and voltmeter reading is $12$ $\mathrm{volt}.$ Then $R$ is equal to .............. $\Omega$View Solution
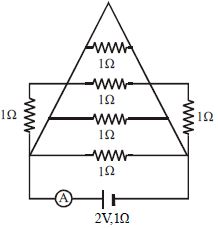
- 4What is the equivalent resistance of the circuit ............. $\Omega$View Solution
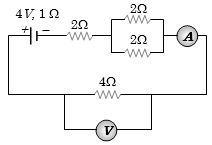
- 5In the circuit shown in Figure the ammeter reads a current ............. $A$View Solution
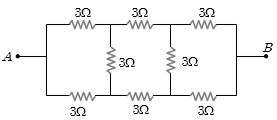
- 6Calculate the equivalent resistance between $A$ and $B$View Solution
- 7The resistance of the filament of an electric bulb changes with temperature. If an electric bulb rated $220\, volt$ and $100\, watt$ is connected $(220 \times 0.8)$ $volt$ sources, then the actual power would beView Solution
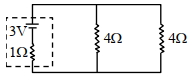
- 8View SolutionIn the given circuit, the terminal potential difference of the cell is:
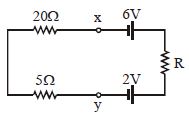
- 9The current flowing in the given circuit is $0.1\,A$ . The potential difference between the points $X$ and $Y$ is ................ $\mathrm{V}$View Solution
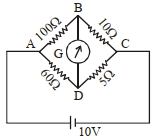
- 10The four arms of a Wheatstone bridge have resistances as shown in the figure. A galvanometer of $15\, \Omega$ resistance is connected across $BD$. Calculate the current through the galvanometer when a potential difference of $10\, V$ is maintained across $AC.$View Solution