Answer


Image
1. The graph shows India's trade in GDP.
2. In the year 2010, the contribution of trade in GDP was 50%.
3. By 10 % was a decrease in the percentage of GDP in the year from 2010-2016.

Need a full question paper?

Generate a complete, print-ready paper with questions like this in minutes — across 16+ boards, with answer keys.

Start Generating Free

Similar questions

Prepare a simple bar graph with the help of given statistical information and answer the questions given below-

Brazil-% of urban population

Year % of urban population
1960 47.1
1970 56.8
1980 66.0
1990 74.6
2000 81.5
2010 84.6

Questions-

  1. What is the interval of years in the data?
  2. During which year did rapid urbanization start?
  3. Write five sentences about the analysis of graph.
With the help of given statistical data, prepare a simple bar graph and answer the following questions:
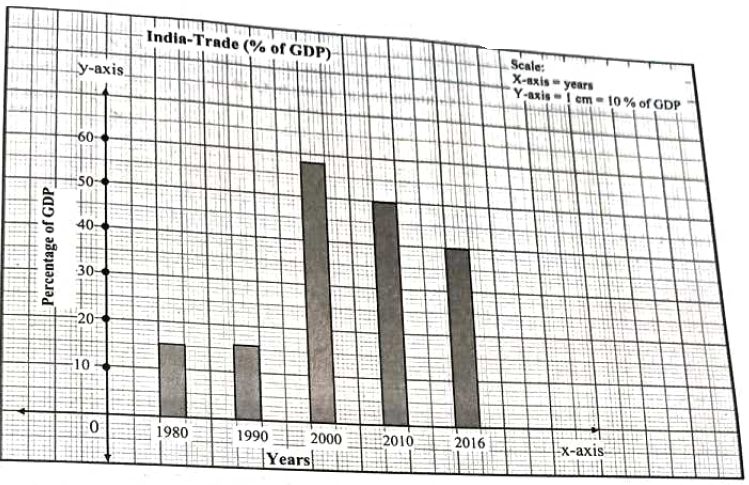
Life Expectancy - India
YearsLife Expectancy
198054
199058
200063
201067
201668
Questions:
1. In the year 1990 what is the average life expectancy?
2. In which two decades, the average life expectancy is found to be similar increase?
3. How much increase can be seen in the life expectancy from 1990 to 2016?
Observe the following graph and answer the questions given below-

Brazil- % of population (2016)


  1. Which type of graph is this?
  2. Which age group has the highest population?
  3. Write class interval of age groups given on Y-axis.
  4. Whose number is more in males and females of age above 60?
  5. How much percent of females are found in age group of 55 to 59 years?
  6. After which age group is the decrease in population found?
Read the graph and answer the following questions:
Image
1. What does the above graph show?
2. In which age group population is more?
3. What is the class interval of the data shown on ' Y ' axis?
4. In the age group of above 60 years whose population is more, male or female?
Prepare a simple bar graph with the help of given statistical information and answer the questions given below-

Export of India to Brazil (million US dollars)

Year Export
2008 3700
2009 2200
2010 4200
2011 6100
2012 5000

Questions-

  1. How much export was found in 2008?
  2. In which year highest export of India was found?
  3. How much export increased in millions between 2009 and 2011?