Question 14 Marks
What would be an effect on equilibrium price and quantity when demand and supply both increase at the same rate?
OR
Explain with the help of a diagram a situation when demand and supply curves shift to the right but equilibrium price remains the same.
OR
Market for a good is in equilibrium. What is the effect on equilibrium price and quantity if both the market demand and the market supply of the goods increase in the same proportion? Use diagram.
OR
Explain with the help of a diagram a situation when demand and supply curves shift to the right but equilibrium price remains the same.
OR
Market for a good is in equilibrium. What is the effect on equilibrium price and quantity if both the market demand and the market supply of the goods increase in the same proportion? Use diagram.
Answer
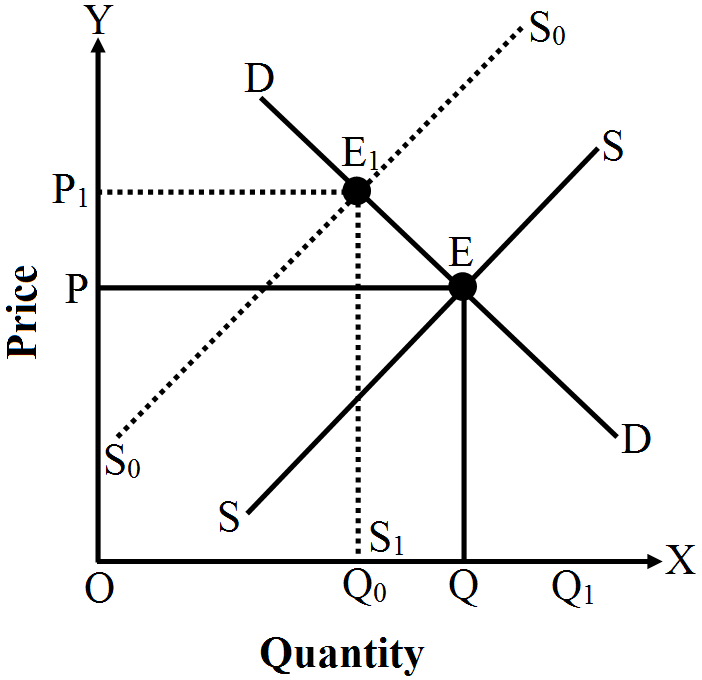
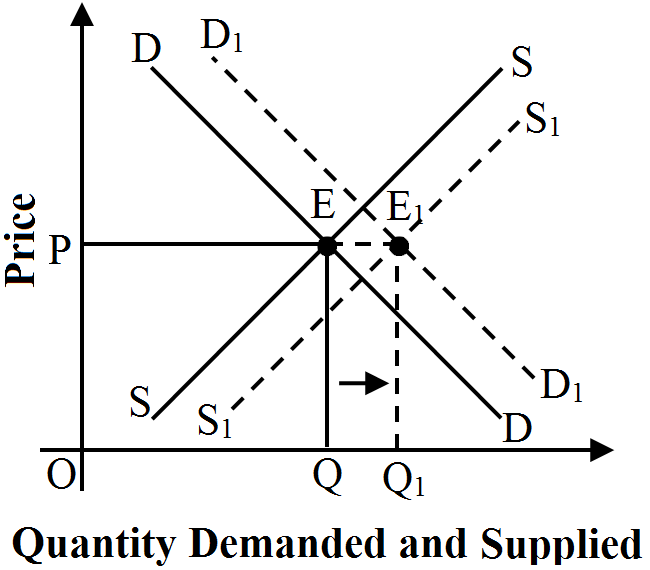
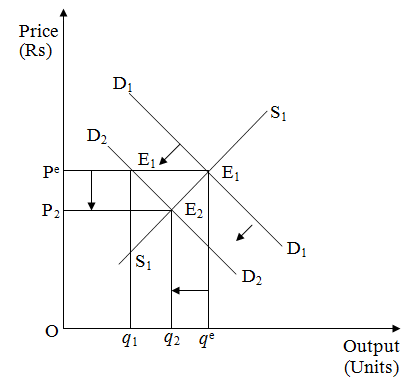
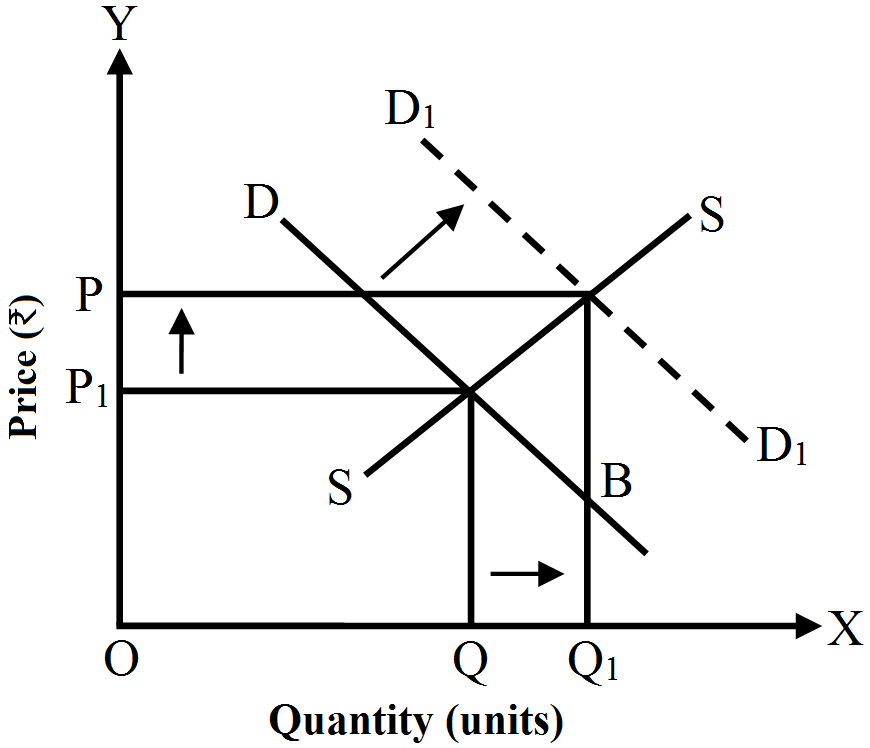
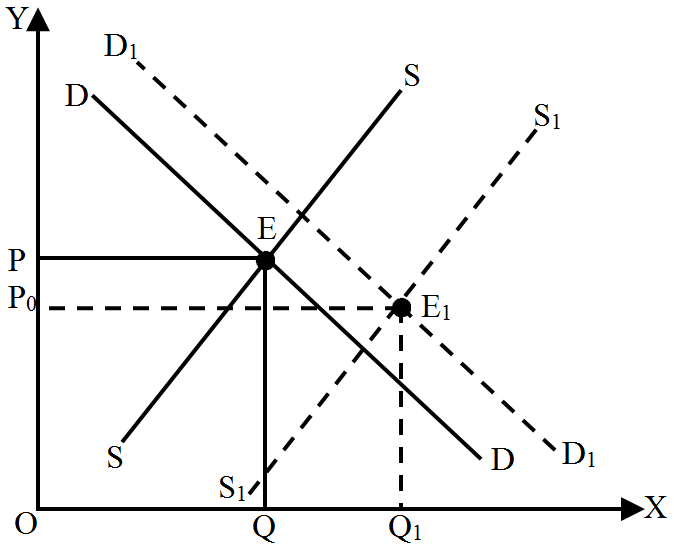
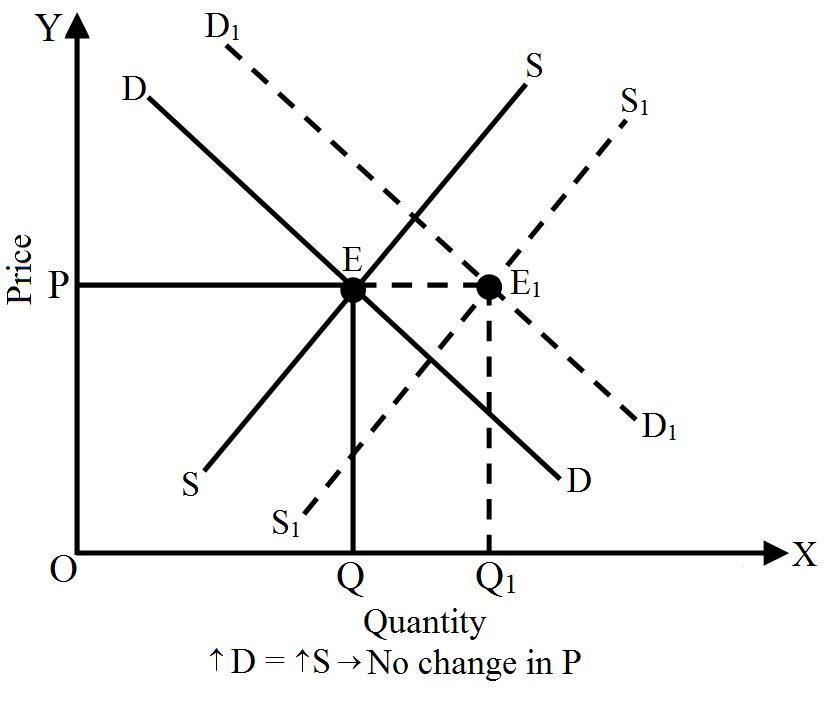
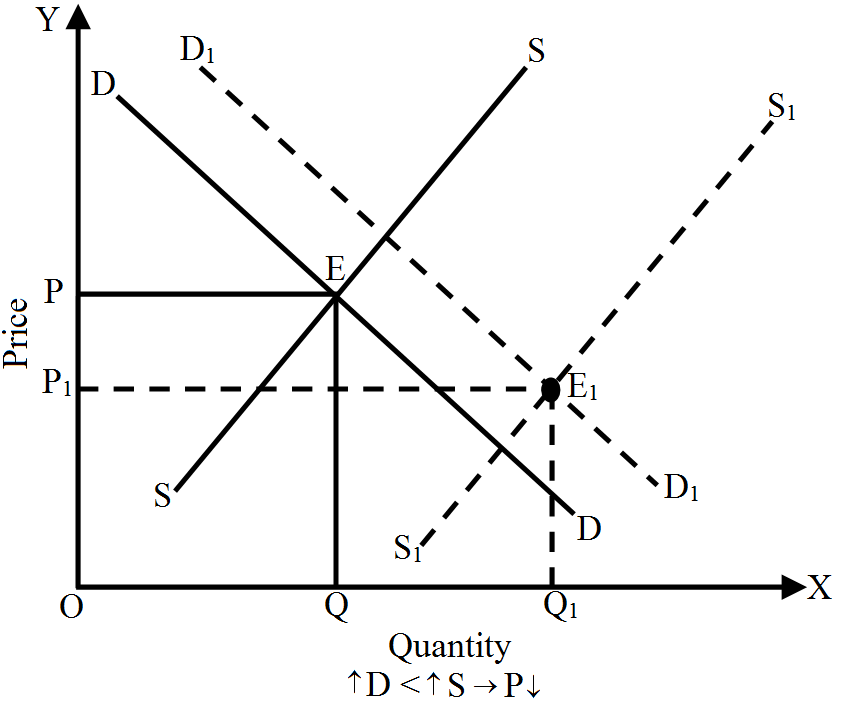
View full question & answer→When demand and supply both increase at the same rate, equilibrium price remains constant and equilibrium quantity rises. It can be shown with the help of the following diagram.
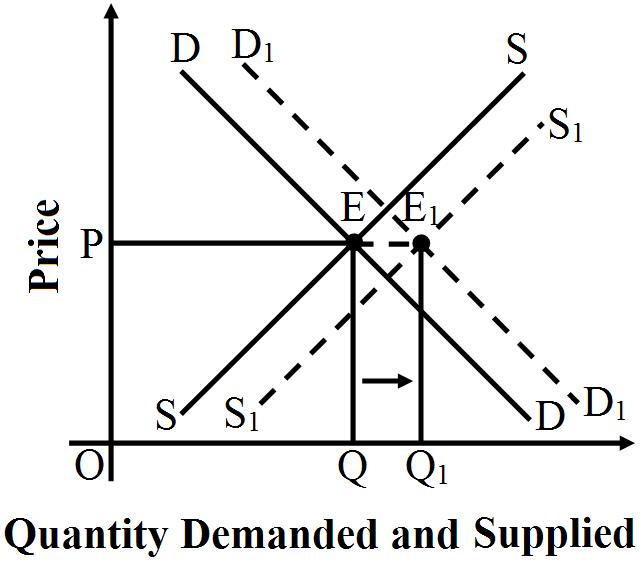
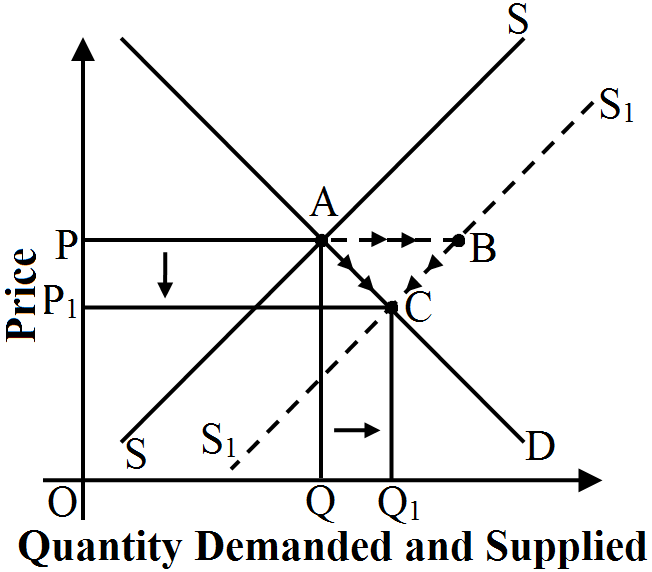
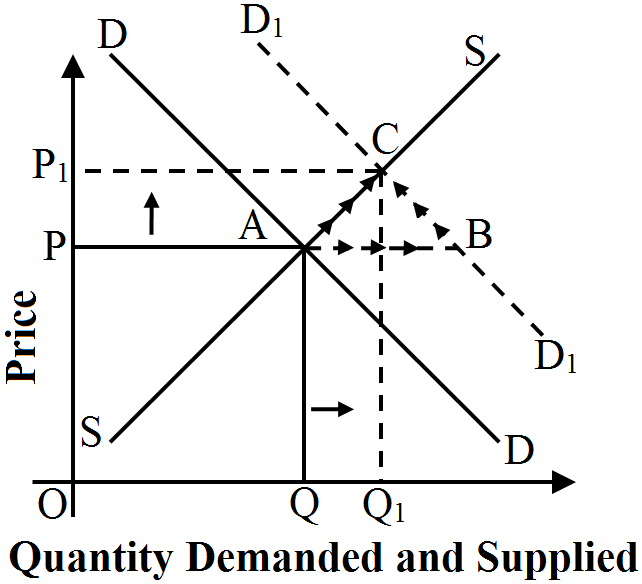
In the above diagram price is measured on vertical axis and quantity demanded and supplied is measured on horizontal axis. Initially, the equilibrium price is $OP$ and equilibrium quantity is $OQ$. But as given in the examination problem, "demand and supply both increase at the same rate", then,
In the above diagram price is measured on vertical axis and quantity demanded and supplied is measured on horizontal axis. Initially, the equilibrium price is $OP$ and equilibrium quantity is $OQ$. But as given in the examination problem, "demand and supply both increase at the same rate", then,
- Equilibrium price remains constant at $OP$.
- Equilibrium quantity rises from $OQ$ to $OQ_1$
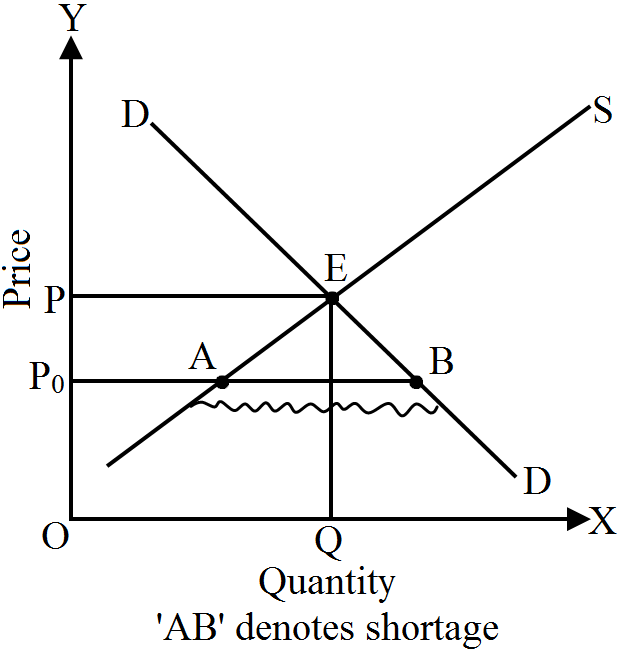
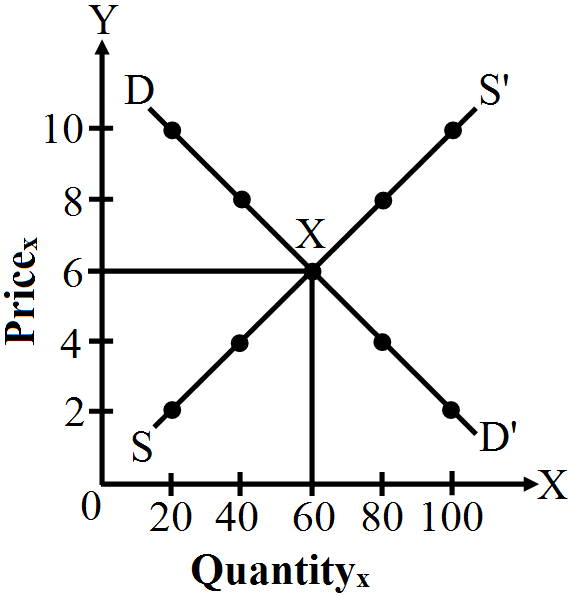
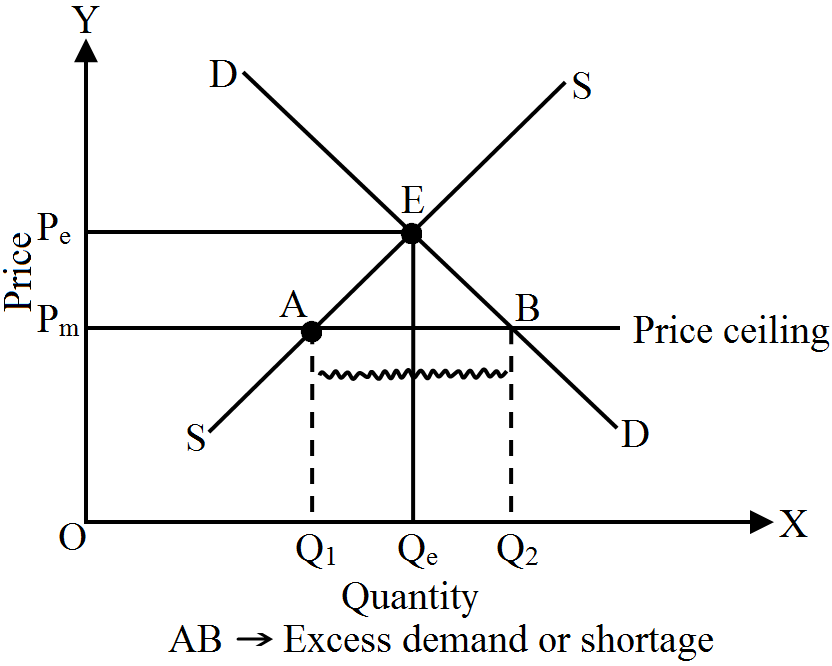
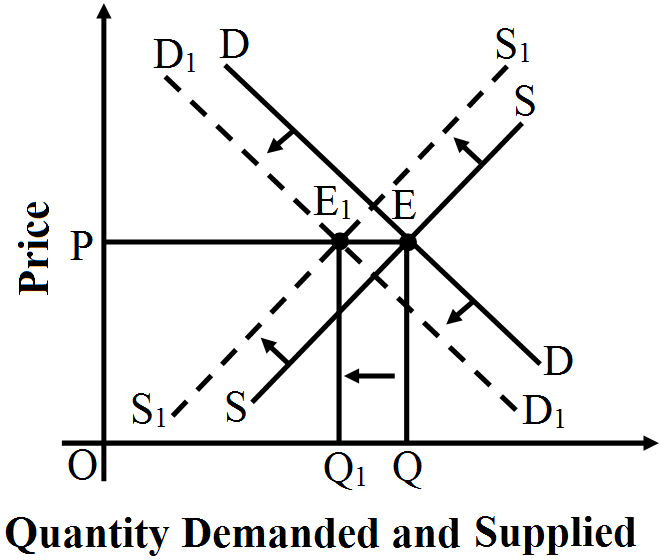
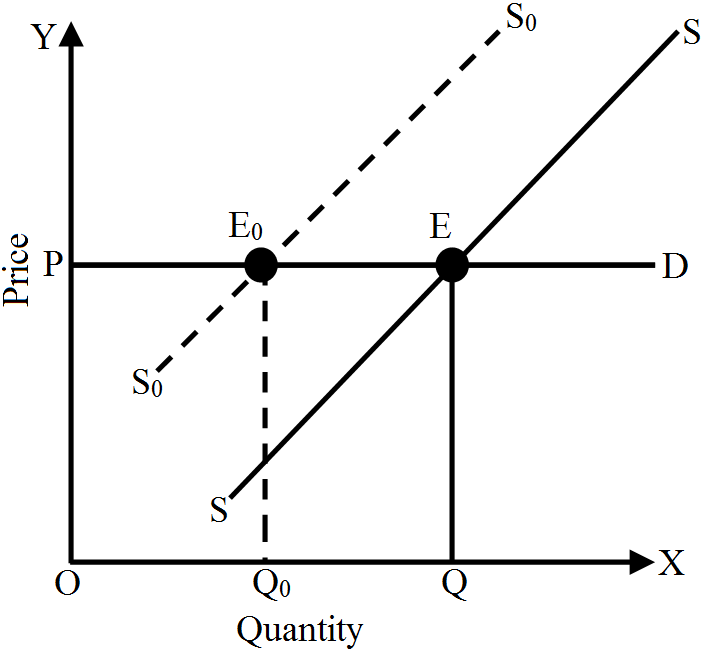
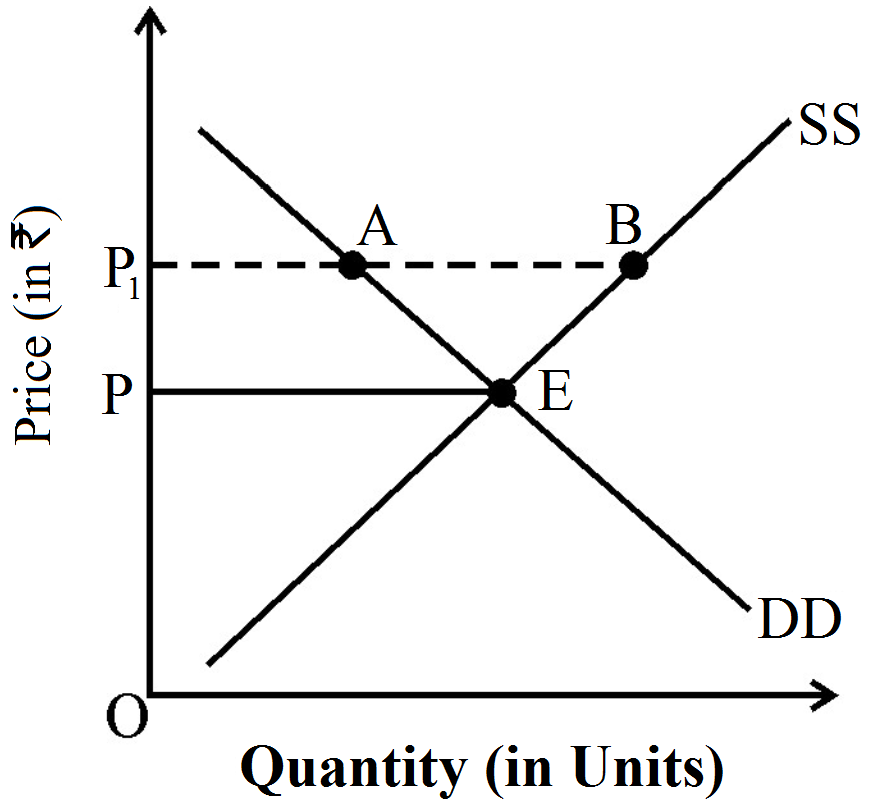
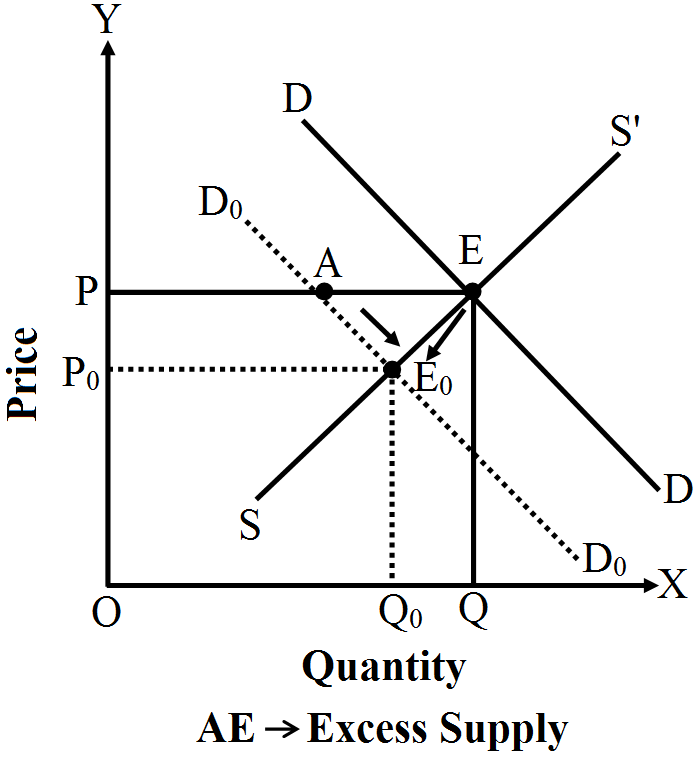
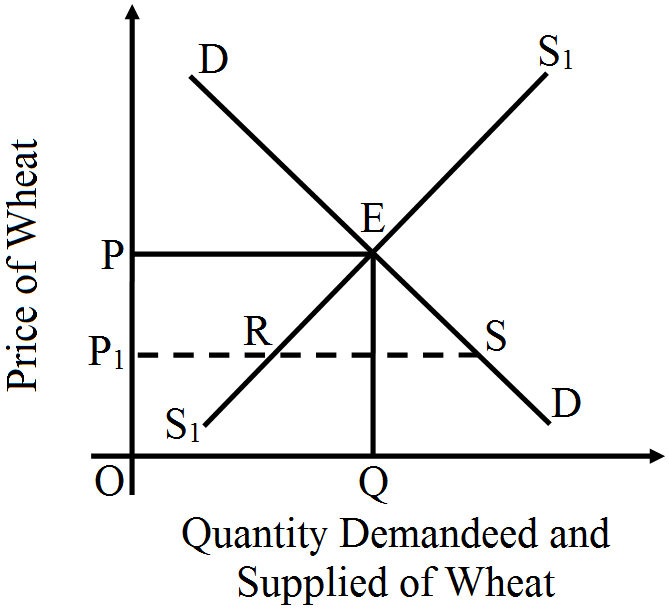
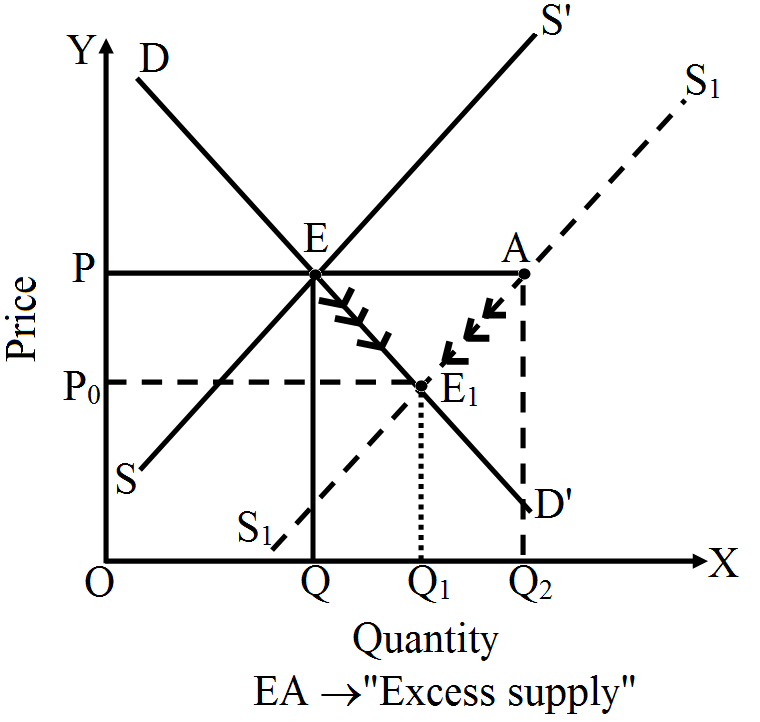 In the diagram, DD' and SS' denote the demand curve and supply curve of the given commodity, Point E denotes the point of equilibrium, where $DD ^{\prime}= SS$. . OP is the given equilibrium price and OQ is the given equilibrium quantity. With increase in supply of good, the supply curve shifts to right. When SS curve shifts to right then at OP price new quantity supplied is $O Q_2$, which is greater than quantity demanded $O Q_1$ by $Q Q_2$. The excess supply equal to $Q Q_2$ or EA emerges.
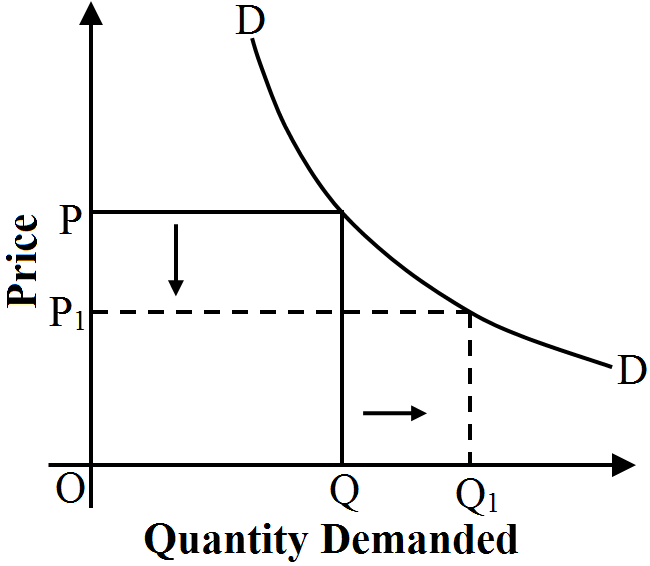
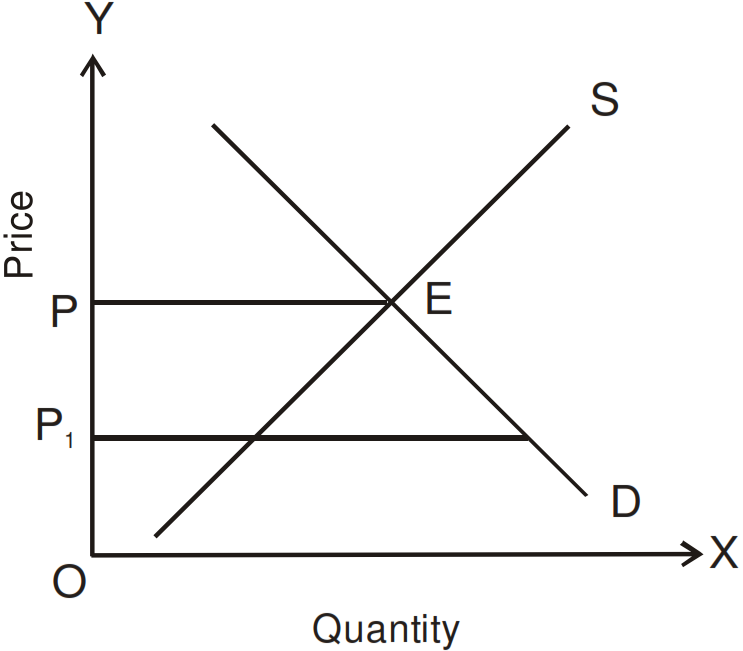
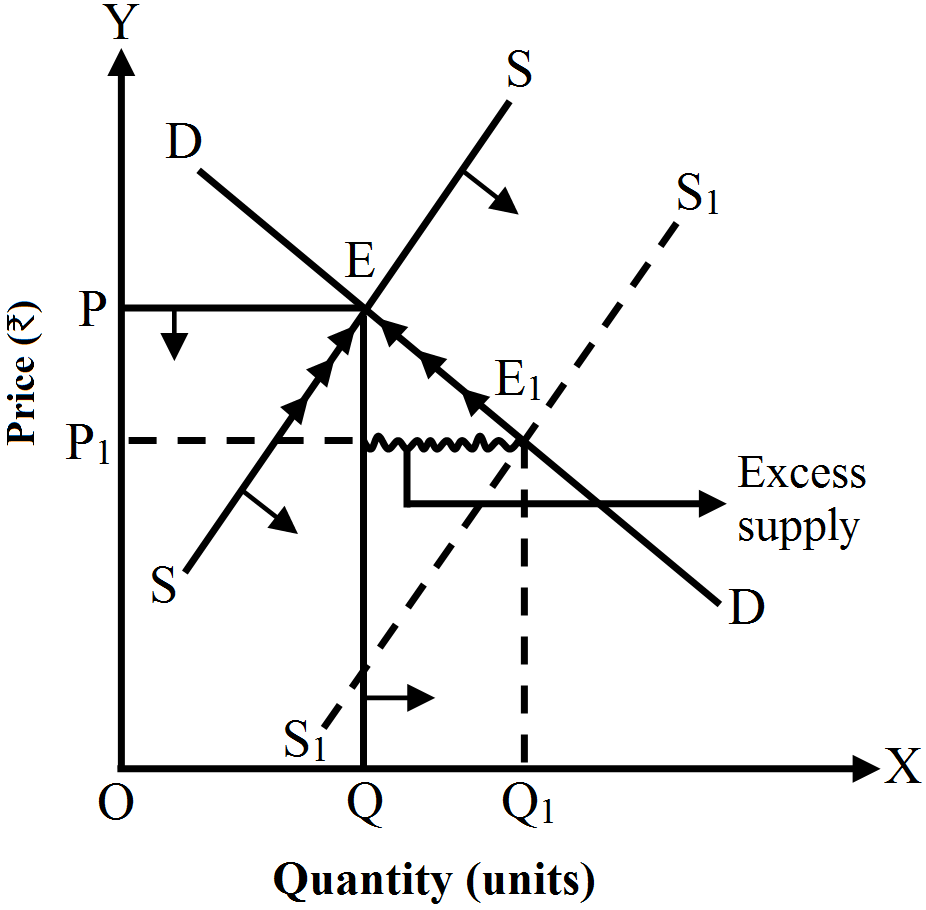
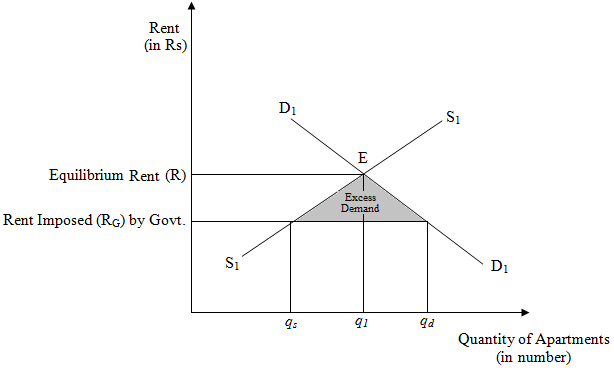 The above figure depicts an equilibrium and an effect of price ceiling (maximum rent).