The difference between the highest and lowest values of the observations is called:
- ARange.
- BClass-intervals.
- CMean.
- DFrequency.
268 questions across 6 question groups — pick any mix to generate a Maths paper with step-by-step answer keys.
M.C.Q
230 Q→021 Marks Question
5 Q→03Match the Following.
2 Q→043 Marks Question
1 Q→054 Marks Questions
19 Q→06Case study (4 Marks)
11 Q→One sample from each question group in this chapter. Select any group above to see the full set with answer keys.
| Column 1 | Column 2 | ||
| Q.1. | Upper boundary of the class interval 51 - 60 | A. | 50 |
| Q.2. | Lower boundary of the class interval 35 - 44 | B. | 60 |
| C. | 35 |
| Column 1 | Column 2 | ||
| Q.1. | Class width of the class interval 30.5 – 35.5 | A. | 80 |
| Q.2. | Midpoint of the class interval 70 – 90 | B. | 40 |
| C. | 5 |
| Number of letters | Number of surnames |
|---|---|
| 1-4 | 6 |
| 4-6 | 30 |
| 6-8 | 44 |
| 8-12 | 16 |
| 12-20 | 4 |
| Age (in years) | Number of children |
| 1-2 | 5 |
| 2-3 | 3 |
| 3-5 | 6 |
| 5-7 | 12 |
| 7-10 | 9 |
| 10-15 | 10 |
| 15-17 | 4 |
Draw a histogram to represent the data above.
| Number of balls | Team A | Team B |
|---|---|---|
| 1-6 | 2 | 5 |
| 7-12 | 1 | 6 |
| 13-18 | 8 | 2 |
| 19-24 | 9 | 10 |
| 25-30 | 4 | 5 |
| 31-36 | 5 | 6 |
| 37-42 | 6 | 3 |
| 43-48 | 10 | 4 |
| 49-54 | 6 | 8 |
| 55-60 | 2 | 10 |
Represent the data of both the teams on the same graph by frequency polygons.
[Hint: First make the class intervals continuous.]
| Section A | Section B | ||
|---|---|---|---|
| Marks | Frequency | Marks | Frequency |
| 0-10 | 3 | 0-10 | 5 |
| 10-20 | 9 | 10-20 | 19 |
| 20-30 | 17 | 20-30 | 15 |
| 30-40 | 12 | 30-40 | 10 |
| 40-50 | 9 | 40-50 | 1 |
Represent the marks of the students of both the sections on the same graph by frequency polygons.
| Life time(in hours) | Number of lamps |
|---|---|
| 300-400 | 14 |
| 400-500 | 56 |
| 500-600 | 60 |
| 600-700 | 86 |
| 700-800 | 74 |
| 800-900 | 62 |
| 900-1000 | 48 |
Haemoglobin (mg/dl) counts | No. of females |
5 | 3 |
6 | 3 |
7 | 2 |
8 | 5 |
9 | 1 |
10 | 1 |
11 | 3 |
12 | 4 |
13 | 2 |
14 | 1 |
4. A haemoglobin counts below 12 is considered deicient.
What proportion of females in the survey can be considered deicient?
A. $\frac{3}{25}$
B. $\frac{4}{25}$
C. $\frac{18}{25}$
D. $\frac{22}{25}$
5. What is the median haemoglobin counts (mg/dl) of the females in the survey?
A. 8
B. 9
C. 9.5
D. 12.5
6.Divya said that 8 and 12 are the most observed haemoglobin counts (mg/dl) among 25 females.
Krishna said that 8 and 12 are the most observed haemoglobin counts (mg/dl) among 100 females in the village.
Who is correct? Explain your answer.
Name | Anchal | Amisha | Mahi | Vishu | Sahar |
Expenditure (in Rs) | 3000 | 5000 | 6000 | 4500 | 7000 |
1. Which graphical representation method would best represent the data given?
2. What is the average expense of the friends for the month of November?
3. Anchal says, “The difference between the median expenditures for October and November amounts to 0% of the November expense, and we have been able to reduce our median expense for November.”
What was their median expense for the month of October?
A. 12π
B. 15π
C. 19π
D. 20π
Time(s) in minutes | Cumulative Score of Team A | Cumulative Score of Team A |
| 0-5 | 14 | 20 |
| 5-10 | 35 | 27 |
| 10-15 | 30 | 31 |
| 15-20 | 35 | 31 |
| 20-25 | 44 | 37 |
| 25-30 | 52 | 50 |
7. How many score points did team A get between 10-15 minutes?
A. 6
B. 24
C. 30
D. 68
8. Which team scored more points during last 5 minutes? Justify your answer.
9. What is the mean number of score points obtained by team A in a 5-minute interval rounded to the nearest whole number?
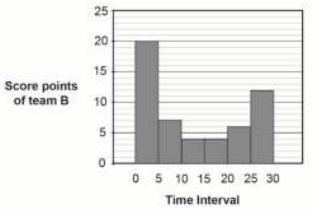
10. Suman says, “Arun’s graphical representation is not appropriate.”
Do you agree with Suman? Mention YES or NO. Give reason to justify your choice.
Pick question groups from the list above, set marks and difficulty, and export a branded PDF with step-by-step answer keys. First 3 chapters free — no signup.